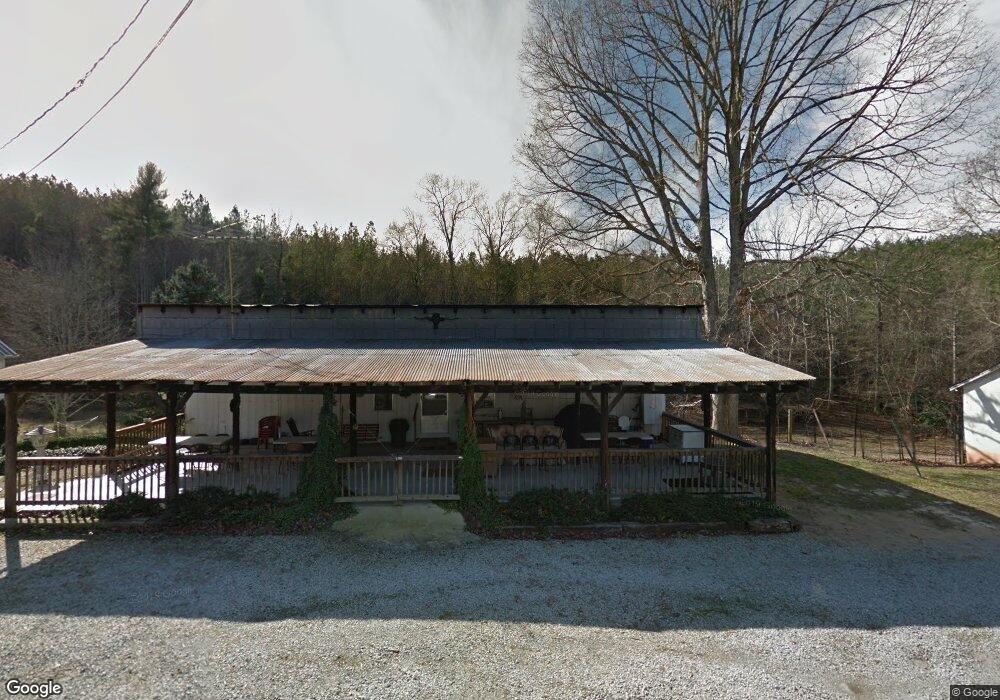
2797 Us 70 W Unit 2817 Morganton, NC 28655
Estimated Value: $251,000 - $272,000
3
Beds
3
Baths
1,392
Sq Ft
$188/Sq Ft
Est. Value
About This Home
This home is located at 2797 Us 70 W Unit 2817, Morganton, NC 28655 and is currently estimated at $261,477, approximately $187 per square foot. 2797 Us 70 W Unit 2817 is a home located in Burke County with nearby schools including Glen Alpine Elementary School, Table Rock Middle School, and Freedom High School.
Ownership History
Date
Name
Owned For
Owner Type
Purchase Details
Closed on
Jul 10, 2024
Sold by
Reinhardt Dennis James and Reinhardt Windy Autumn
Bought by
Salig Jeremy Roy
Current Estimated Value
Home Financials for this Owner
Home Financials are based on the most recent Mortgage that was taken out on this home.
Original Mortgage
$245,000
Outstanding Balance
$242,096
Interest Rate
7.03%
Mortgage Type
New Conventional
Estimated Equity
$19,381
Purchase Details
Closed on
Oct 5, 2020
Sold by
Norman Harold Leon and Norman Edwin
Bought by
Reinhardt Dennis James and Reinhardt Windy Autumn
Home Financials for this Owner
Home Financials are based on the most recent Mortgage that was taken out on this home.
Original Mortgage
$98,420
Interest Rate
3.1%
Mortgage Type
VA
Create a Home Valuation Report for This Property
The Home Valuation Report is an in-depth analysis detailing your home's value as well as a comparison with similar homes in the area
Home Values in the Area
Average Home Value in this Area
Purchase History
| Date | Buyer | Sale Price | Title Company |
|---|---|---|---|
| Salig Jeremy Roy | $260,000 | None Listed On Document | |
| Reinhardt Dennis James | $533,800 | None Available |
Source: Public Records
Mortgage History
| Date | Status | Borrower | Loan Amount |
|---|---|---|---|
| Open | Salig Jeremy Roy | $245,000 | |
| Previous Owner | Reinhardt Dennis James | $98,420 |
Source: Public Records
Tax History Compared to Growth
Tax History
| Year | Tax Paid | Tax Assessment Tax Assessment Total Assessment is a certain percentage of the fair market value that is determined by local assessors to be the total taxable value of land and additions on the property. | Land | Improvement |
|---|---|---|---|---|
| 2025 | $1,433 | $192,215 | $22,750 | $169,465 |
| 2024 | $1,165 | $192,215 | $22,750 | $169,465 |
| 2023 | $1,077 | $151,015 | $22,750 | $128,265 |
| 2022 | $1,029 | $117,580 | $16,236 | $101,344 |
| 2021 | $792 | $88,908 | $16,236 | $72,672 |
| 2020 | $788 | $88,908 | $16,236 | $72,672 |
| 2019 | $788 | $88,908 | $16,236 | $72,672 |
| 2018 | $737 | $83,685 | $16,236 | $67,449 |
| 2017 | $735 | $83,685 | $16,236 | $67,449 |
| 2016 | $718 | $83,685 | $16,236 | $67,449 |
| 2015 | $715 | $83,685 | $16,236 | $67,449 |
| 2014 | $713 | $83,685 | $16,236 | $67,449 |
| 2013 | $713 | $83,685 | $16,236 | $67,449 |
Source: Public Records
Map
Nearby Homes
- 3903 Dysartsville Rd
- 2991 Corpening Chapel Rd
- 2958 Corpening Chapel Rd
- 4937 Snowhill Church Rd
- 00 Snowhill Church Rd
- TBD Snowhill Church Rd
- 279 Outback Trail
- 28 Outback Trail
- 133 James Bob Stafford Dr
- Lot 6 Theresa Terrace Unit 6
- 4148 Tallent Rd
- 8426 US 70 E
- 4188 Tallent Rd
- 00 Stow-A-way Dr Unit 44
- 36 Everett Dr
- 4655 Mcalpine Ave
- 4762 Tallent Rd
- TBD Misty Mountain Dr Unit 35
- TBD Misty Mountain Dr Unit top of mountain
- 2691 Laurel Point Dr Unit 23
- 2817 U S 70
- 2705 Us 70 W
- 2685 Us 70 W
- 2671 Us 70 W Unit 2681
- 2665 Us 70 W
- 2663 Us 70 W
- 2595 Us 70 W
- 2585 Us 70 W
- 2575 Us 70 W
- 3481 Seals Rd
- 3504 Irish Hills Rd
- 3504 Irish Hills Rd
- 3515 Seals Rd
- 3589 Seals Rd
- 5071 Snowhill Church Rd
- 0 Irish Hills Rd Unit 1 B32876
- 0 Irish Hills Rd Unit B32878
- 5847 Old Us Highway 70 Loop Unit 49
- 3619 Seals Rd
- 2468 Us 70 W