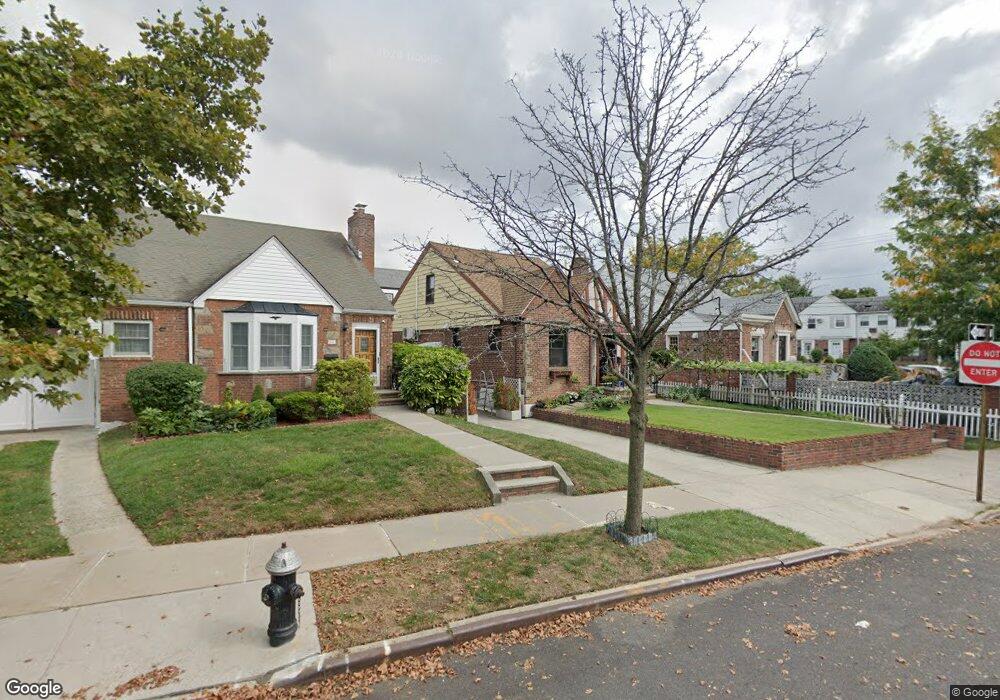
28-49 Utopia Pkwy Flushing, NY 11358
Auburndale NeighborhoodEstimated Value: $919,000 - $973,006
3
Beds
3
Baths
1,280
Sq Ft
$742/Sq Ft
Est. Value
About This Home
This home is located at 28-49 Utopia Pkwy, Flushing, NY 11358 and is currently estimated at $949,252, approximately $741 per square foot. 28-49 Utopia Pkwy is a home located in Queens County with nearby schools including I.S. 25 Adrien Block, Bayside High School, and Our Lady of the Blessed Sacrament Catholic Academy.
Ownership History
Date
Name
Owned For
Owner Type
Purchase Details
Closed on
Jul 12, 2021
Sold by
Wong Ivan J and Yang Wong Kacily
Bought by
Chen Qin and Zhang Junxian
Current Estimated Value
Home Financials for this Owner
Home Financials are based on the most recent Mortgage that was taken out on this home.
Original Mortgage
$350,000
Outstanding Balance
$316,341
Interest Rate
2.93%
Mortgage Type
Purchase Money Mortgage
Estimated Equity
$632,911
Purchase Details
Closed on
Aug 22, 2008
Sold by
Wong Chi Hung and Wong Yuet Kam
Bought by
Wong Ivan J and Yang Xiao Dan
Home Financials for this Owner
Home Financials are based on the most recent Mortgage that was taken out on this home.
Original Mortgage
$333,000
Interest Rate
6.69%
Mortgage Type
Purchase Money Mortgage
Create a Home Valuation Report for This Property
The Home Valuation Report is an in-depth analysis detailing your home's value as well as a comparison with similar homes in the area
Home Values in the Area
Average Home Value in this Area
Purchase History
| Date | Buyer | Sale Price | Title Company |
|---|---|---|---|
| Chen Qin | $900,000 | -- | |
| Chen Qin | $900,000 | -- | |
| Wong Ivan J | $573,000 | -- | |
| Wong Ivan J | $573,000 | -- |
Source: Public Records
Mortgage History
| Date | Status | Borrower | Loan Amount |
|---|---|---|---|
| Open | Chen Qin | $350,000 | |
| Closed | Chen Qin | $350,000 | |
| Previous Owner | Wong Ivan J | $333,000 |
Source: Public Records
Tax History Compared to Growth
Tax History
| Year | Tax Paid | Tax Assessment Tax Assessment Total Assessment is a certain percentage of the fair market value that is determined by local assessors to be the total taxable value of land and additions on the property. | Land | Improvement |
|---|---|---|---|---|
| 2025 | $8,664 | $44,358 | $10,134 | $34,224 |
| 2024 | $8,664 | $43,139 | $10,264 | $32,875 |
| 2023 | $8,174 | $40,698 | $9,694 | $31,004 |
| 2022 | $7,665 | $56,100 | $12,720 | $43,380 |
| 2021 | $7,781 | $52,800 | $12,720 | $40,080 |
| 2020 | $7,824 | $55,740 | $12,720 | $43,020 |
| 2019 | $7,520 | $50,340 | $12,720 | $37,620 |
| 2018 | $6,914 | $33,915 | $9,574 | $24,341 |
| 2017 | $6,523 | $31,998 | $8,334 | $23,664 |
| 2016 | $6,160 | $31,998 | $8,334 | $23,664 |
| 2015 | $3,641 | $30,804 | $10,139 | $20,665 |
| 2014 | $3,641 | $29,958 | $10,187 | $19,771 |
Source: Public Records
Map
Nearby Homes
- 28-07 172nd St
- 26-23 Utopia Pkwy
- 201-05 28th Ave
- 201-20 28th Ave
- 29-31 170th St
- 199-27 26th Ave
- 19929 26th Ave
- 32-28 202nd St
- 29-37 168th St
- 27-01 167th St
- 20015 33rd Ave
- 2533 Francis Lewis Blvd
- 2931 167th St
- 190-16 33rd Ave
- 25-31 Bayside Ln
- 16627 25th Ave
- 3211 204th St
- 20206 33rd Ave
- 3321 201st St
- 32-16 167th St
- 2849 Utopia Pkwy
- 2853 Utopia Pkwy
- 28-53 Utopia Pkwy
- 2845 Utopia Pkwy
- 19819 29th Ave
- 19821 29th Ave
- 2841 Utopia Pkwy
- 19823 29th Ave
- 19825 29th Ave
- 2837 Utopia Pkwy
- 198-27 29th Ave
- 19827 29th Ave
- 28-33 Utopia Pkwy
- 198-29 29th Ave
- 2901 Utopia Pkwy
- 19829 29th Ave
- 2833 Utopia Pkwy
- 19816 29th Ave
- 2901 Utopia Pkwy
- 19814 29th Ave