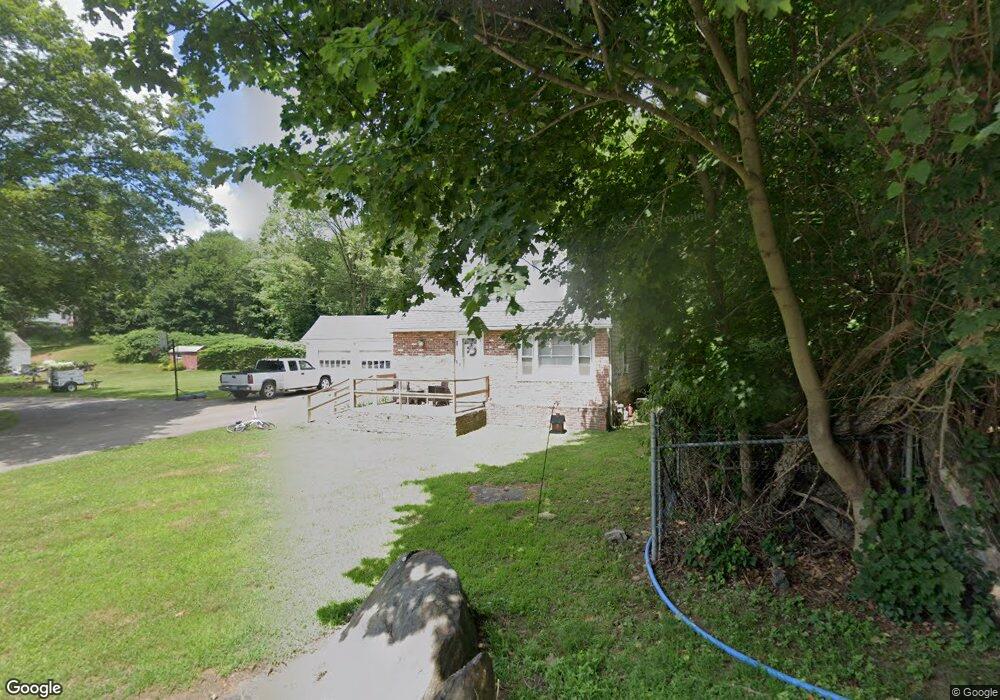
28 Hardwick St Cumberland, RI 02864
Berkeley NeighborhoodEstimated Value: $436,000 - $506,000
3
Beds
2
Baths
1,663
Sq Ft
$288/Sq Ft
Est. Value
About This Home
This home is located at 28 Hardwick St, Cumberland, RI 02864 and is currently estimated at $479,295, approximately $288 per square foot. 28 Hardwick St is a home located in Providence County with nearby schools including Garvin Memorial School, Joseph L. McCourt Middle School, and Cumberland High School.
Ownership History
Date
Name
Owned For
Owner Type
Purchase Details
Closed on
Jan 1, 2024
Sold by
Lb Corp
Bought by
Lb Corp Llc
Current Estimated Value
Purchase Details
Closed on
Jan 29, 1996
Sold by
Jh Lynch & Sons Inc
Bought by
Lb Corp
Home Financials for this Owner
Home Financials are based on the most recent Mortgage that was taken out on this home.
Original Mortgage
$1,131,100
Interest Rate
7.13%
Mortgage Type
Purchase Money Mortgage
Create a Home Valuation Report for This Property
The Home Valuation Report is an in-depth analysis detailing your home's value as well as a comparison with similar homes in the area
Home Values in the Area
Average Home Value in this Area
Purchase History
| Date | Buyer | Sale Price | Title Company |
|---|---|---|---|
| Lb Corp Llc | -- | None Available | |
| Lb Corp | $1,156,000 | -- |
Source: Public Records
Mortgage History
| Date | Status | Borrower | Loan Amount |
|---|---|---|---|
| Previous Owner | Lb Corp | $1,131,100 |
Source: Public Records
Tax History Compared to Growth
Tax History
| Year | Tax Paid | Tax Assessment Tax Assessment Total Assessment is a certain percentage of the fair market value that is determined by local assessors to be the total taxable value of land and additions on the property. | Land | Improvement |
|---|---|---|---|---|
| 2025 | $4,318 | $351,900 | $162,700 | $189,200 |
| 2024 | $4,205 | $351,900 | $162,700 | $189,200 |
| 2023 | $4,089 | $351,900 | $162,700 | $189,200 |
| 2022 | $3,761 | $250,900 | $113,800 | $137,100 |
| 2021 | $3,698 | $250,900 | $113,800 | $137,100 |
| 2020 | $3,593 | $250,900 | $113,800 | $137,100 |
| 2019 | $3,473 | $218,700 | $95,100 | $123,600 |
| 2018 | $3,372 | $218,700 | $95,100 | $123,600 |
| 2017 | $3,326 | $218,700 | $95,100 | $123,600 |
| 2016 | $3,040 | $178,000 | $86,600 | $91,400 |
| 2015 | $3,040 | $178,000 | $86,600 | $91,400 |
| 2014 | $3,040 | $178,000 | $86,600 | $91,400 |
| 2013 | $3,188 | $202,000 | $86,200 | $115,800 |
Source: Public Records
Map
Nearby Homes