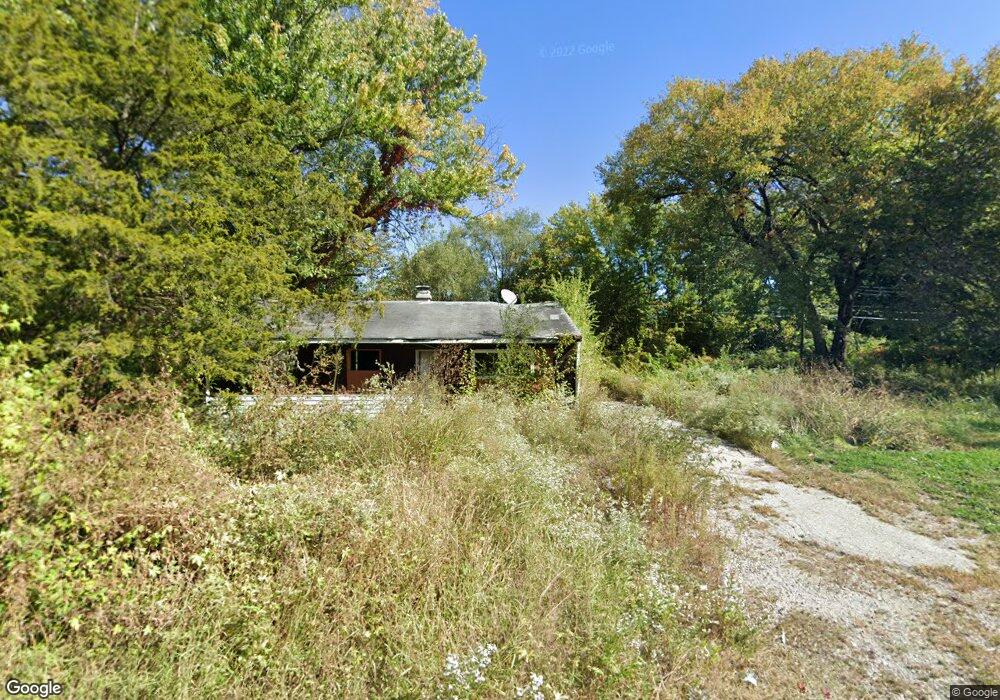
28 Lauralee Dr East Saint Louis, IL 62206
Estimated Value: $39,000 - $75,645
--
Bed
--
Bath
925
Sq Ft
$59/Sq Ft
Est. Value
About This Home
This home is located at 28 Lauralee Dr, East Saint Louis, IL 62206 and is currently estimated at $54,661, approximately $59 per square foot. 28 Lauralee Dr is a home located in St. Clair County.
Ownership History
Date
Name
Owned For
Owner Type
Purchase Details
Closed on
Dec 27, 2024
Sold by
St Clair County
Bought by
Wilson Dwayne
Current Estimated Value
Purchase Details
Closed on
Apr 2, 2021
Sold by
Mcclam Pamela and Mcclam Thomas
Bought by
Johnson Malcolm
Purchase Details
Closed on
Jul 16, 2012
Sold by
County Of Saint Clair
Bought by
Mcclain Pamela D and Mcclain Thomas J
Purchase Details
Closed on
Jun 28, 2011
Sold by
Mcclain Pamela and Mcclain Thomas
Bought by
County Of Saint Clair
Purchase Details
Closed on
May 11, 2001
Sold by
Spears Jasper and Spears Rubye
Bought by
Mcclain Pamela D and Mcclain Thomas J
Create a Home Valuation Report for This Property
The Home Valuation Report is an in-depth analysis detailing your home's value as well as a comparison with similar homes in the area
Home Values in the Area
Average Home Value in this Area
Purchase History
| Date | Buyer | Sale Price | Title Company |
|---|---|---|---|
| Wilson Dwayne | -- | None Available | |
| Johnson Malcolm | -- | None Available | |
| Mcclain Pamela D | -- | None Available | |
| County Of Saint Clair | -- | None Available | |
| Mcclain Pamela D | -- | -- |
Source: Public Records
Tax History Compared to Growth
Tax History
| Year | Tax Paid | Tax Assessment Tax Assessment Total Assessment is a certain percentage of the fair market value that is determined by local assessors to be the total taxable value of land and additions on the property. | Land | Improvement |
|---|---|---|---|---|
| 2024 | -- | $110 | $55 | $55 |
| 2023 | $665 | $4,490 | $418 | $4,072 |
| 2022 | $570 | $3,935 | $366 | $3,569 |
| 2021 | $592 | $3,729 | $347 | $3,382 |
| 2020 | $650 | $3,907 | $364 | $3,543 |
| 2019 | $0 | $3,907 | $364 | $3,543 |
| 2018 | $0 | $3,964 | $369 | $3,595 |
| 2017 | $0 | $3,868 | $360 | $3,508 |
| 2016 | $0 | $4,871 | $359 | $4,512 |
| 2014 | -- | $4,818 | $355 | $4,463 |
| 2013 | $202 | $4,519 | $333 | $4,186 |
Source: Public Records
Map
Nearby Homes