Estimated Value: $605,000 - $689,000
3
Beds
3
Baths
1,512
Sq Ft
$425/Sq Ft
Est. Value
About This Home
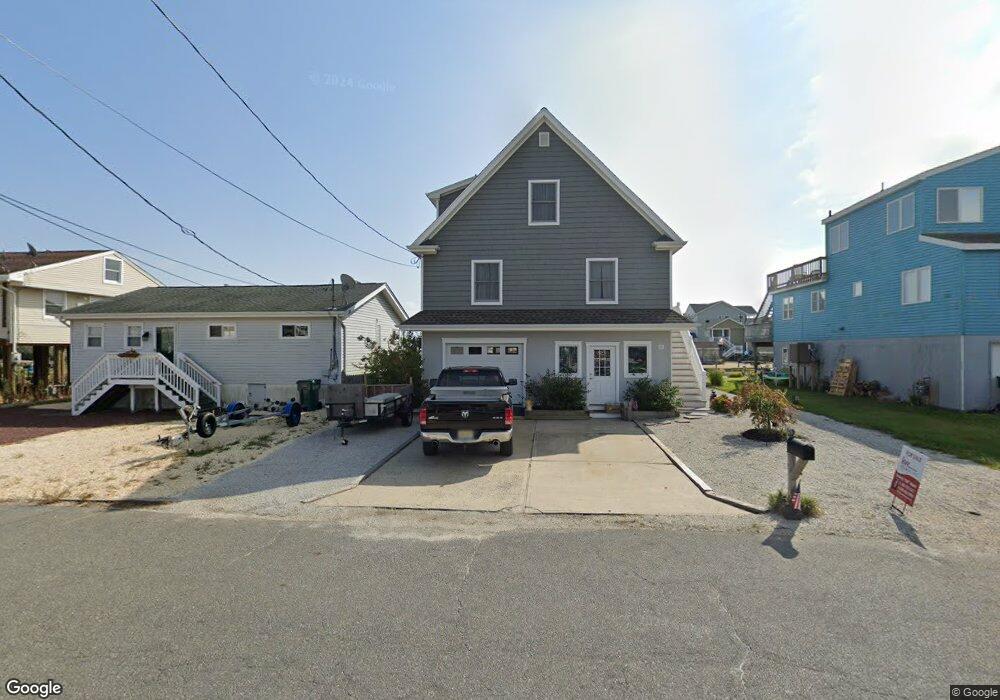
This home is located at 28 N Boom Way, Little Egg Harbor Township, NJ 08087 and is currently estimated at $642,424, approximately $424 per square foot. 28 N Boom Way is a home located in Ocean County with nearby schools including George J. Mitchell Elementary School, Pinelands Regional Junior High School, and Pinelands Regional High School.
Ownership History
Date
Name
Owned For
Owner Type
Purchase Details
Closed on
Aug 25, 2025
Sold by
Lipton Thomas
Bought by
Lipton Sheila
Current Estimated Value
Purchase Details
Closed on
Sep 29, 2020
Sold by
Lipton Thomas
Bought by
Montilla Julian and Montilla Emily
Purchase Details
Closed on
Jul 23, 2020
Sold by
Campagnolo William J and Estate Of John T Dalrymple
Bought by
Vogelman Matthew and Mascola Nadia N
Purchase Details
Closed on
Dec 20, 2017
Sold by
Ocean County Tax Collector
Bought by
Leonardis Richard
Purchase Details
Closed on
Feb 27, 2001
Purchase Details
Closed on
Aug 5, 1998
Sold by
Flynn Donald
Bought by
Flynn Diana H
Home Financials for this Owner
Home Financials are based on the most recent Mortgage that was taken out on this home.
Original Mortgage
$65,000
Interest Rate
6.6%
Create a Home Valuation Report for This Property
The Home Valuation Report is an in-depth analysis detailing your home's value as well as a comparison with similar homes in the area
Home Values in the Area
Average Home Value in this Area
Purchase History
| Date | Buyer | Sale Price | Title Company |
|---|---|---|---|
| Lipton Sheila | -- | None Listed On Document | |
| Montilla Julian | $110,000 | Golden Title | |
| Vogelman Matthew | $185,000 | Trident Land Transfer Co Llc | |
| Leonardis Richard | $241 | None Available | |
| -- | -- | -- | |
| Flynn Diana H | -- | -- |
Source: Public Records
Mortgage History
| Date | Status | Borrower | Loan Amount |
|---|---|---|---|
| Previous Owner | Flynn Diana H | $65,000 |
Source: Public Records
Tax History Compared to Growth
Tax History
| Year | Tax Paid | Tax Assessment Tax Assessment Total Assessment is a certain percentage of the fair market value that is determined by local assessors to be the total taxable value of land and additions on the property. | Land | Improvement |
|---|---|---|---|---|
| 2025 | $7,123 | $240,400 | $80,800 | $159,600 |
| 2024 | $6,825 | $240,400 | $80,800 | $159,600 |
| 2023 | $6,611 | $240,400 | $80,800 | $159,600 |
| 2022 | $6,611 | $240,400 | $80,800 | $159,600 |
| 2021 | $6,455 | $240,400 | $80,800 | $159,600 |
| 2020 | $6,371 | $240,400 | $80,800 | $159,600 |
| 2019 | $6,113 | $240,400 | $80,800 | $159,600 |
| 2018 | $5,765 | $240,400 | $80,800 | $159,600 |
| 2017 | $5,676 | $240,400 | $80,800 | $159,600 |
| 2016 | $5,722 | $240,400 | $80,800 | $159,600 |
| 2015 | $5,791 | $240,400 | $80,800 | $159,600 |
| 2014 | $4,940 | $205,700 | $205,700 | $0 |
Source: Public Records
Map
Nearby Homes
- 26 N Boom Way
- 30 N Boom Way
- 24 N Boom Way
- 32 N Boom Way
- 22 N Boom Way
- 35 N Boom Way
- 35 N Boom Way Unit A
- 20 N Boom Way
- 15 Chesapeake Ct
- 14 Chesapeake Ct
- 18 N Boom Way
- 38 N Boom Way
- 13 Chesapeake Ct
- 15 Hatteras Ct
- 12 Chesapeake Ct
- 16 N Boom Way
- 11 Chesapeake Ct
- 13 Hatteras Ct
- 16 Nantucket Ct
- 9 Chesapeake Ct