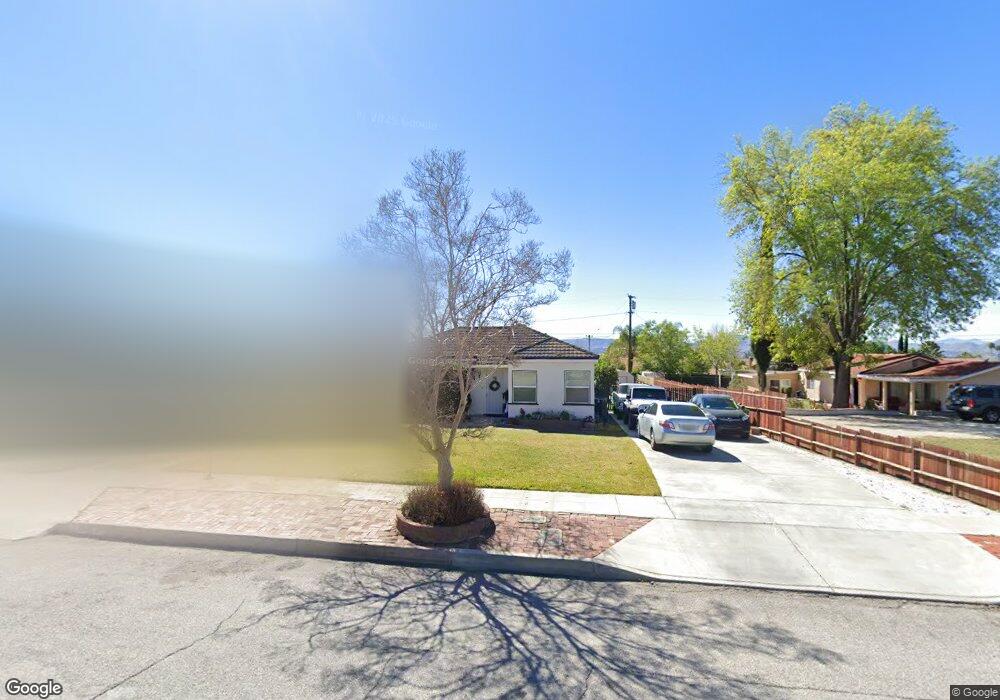
28003 Atlantic Ave Highland, CA 92346
East Highlands NeighborhoodEstimated Value: $414,090 - $489,000
2
Beds
1
Bath
1,526
Sq Ft
$304/Sq Ft
Est. Value
About This Home
This home is located at 28003 Atlantic Ave, Highland, CA 92346 and is currently estimated at $464,273, approximately $304 per square foot. 28003 Atlantic Ave is a home located in San Bernardino County with nearby schools including Thompson Elementary School, Serrano Middle School, and San Gorgonio High School.
Ownership History
Date
Name
Owned For
Owner Type
Purchase Details
Closed on
Jun 8, 2018
Sold by
Bergen Daniel J
Bought by
Janes Ann C and Gentry Steven M
Current Estimated Value
Home Financials for this Owner
Home Financials are based on the most recent Mortgage that was taken out on this home.
Original Mortgage
$179,080
Interest Rate
4.25%
Mortgage Type
FHA
Purchase Details
Closed on
Apr 24, 2003
Sold by
Bergen Caryn J
Bought by
Bergen Daniel J and Bergen Caryn J
Home Financials for this Owner
Home Financials are based on the most recent Mortgage that was taken out on this home.
Original Mortgage
$89,800
Interest Rate
5.61%
Mortgage Type
Purchase Money Mortgage
Purchase Details
Closed on
Mar 5, 1999
Sold by
Gentry Steven R
Bought by
Gentry Caryn J
Home Financials for this Owner
Home Financials are based on the most recent Mortgage that was taken out on this home.
Original Mortgage
$89,165
Interest Rate
7.04%
Mortgage Type
FHA
Create a Home Valuation Report for This Property
The Home Valuation Report is an in-depth analysis detailing your home's value as well as a comparison with similar homes in the area
Home Values in the Area
Average Home Value in this Area
Purchase History
| Date | Buyer | Sale Price | Title Company |
|---|---|---|---|
| Janes Ann C | $220,000 | Fidelity National Title Com | |
| Bergen Daniel J | -- | American Title | |
| Gentry Caryn J | -- | American Title | |
| Gentry Caryn J | $90,000 | American Title Co | |
| Robertson Carla | -- | American Title |
Source: Public Records
Mortgage History
| Date | Status | Borrower | Loan Amount |
|---|---|---|---|
| Previous Owner | Janes Ann C | $179,080 | |
| Previous Owner | Bergen Daniel J | $89,800 | |
| Previous Owner | Gentry Caryn J | $89,165 |
Source: Public Records
Tax History Compared to Growth
Tax History
| Year | Tax Paid | Tax Assessment Tax Assessment Total Assessment is a certain percentage of the fair market value that is determined by local assessors to be the total taxable value of land and additions on the property. | Land | Improvement |
|---|---|---|---|---|
| 2025 | $3,354 | $245,413 | $73,624 | $171,789 |
| 2024 | $3,354 | $240,601 | $72,180 | $168,421 |
| 2023 | $3,280 | $235,884 | $70,765 | $165,119 |
| 2022 | $3,280 | $231,258 | $69,377 | $161,881 |
| 2021 | $3,244 | $226,724 | $68,017 | $158,707 |
| 2020 | $3,238 | $224,400 | $67,320 | $157,080 |
| 2019 | $3,128 | $220,000 | $66,000 | $154,000 |
| 2018 | $1,918 | $123,866 | $27,555 | $96,311 |
| 2017 | $1,616 | $121,438 | $27,015 | $94,423 |
| 2016 | $1,569 | $119,057 | $26,485 | $92,572 |
| 2015 | $1,598 | $117,268 | $26,087 | $91,181 |
| 2014 | $1,555 | $114,971 | $25,576 | $89,395 |
Source: Public Records
Map
Nearby Homes
- 27953 Atlantic Ave
- 27875 Rainbow Ln
- 27888 Rainbow Ln
- 28037 Clifton St
- 28370 Coachman Ln
- 6941 La Praix St
- 0 La Praix St
- 27600 Atlantic Ave Unit 427
- 4040 Piedmont Dr Unit 81
- 4040 Piedmont Dr Unit 289
- 4040 Piedmont Dr Unit 297
- 4040 Piedmont Dr Unit 283
- 4040 Piedmont Dr Unit 113
- 27856 Fieldstone Dr
- 3850 Atlantic Ave Unit 58
- 3850 Atlantic Ave Unit 217
- 3850 Atlantic Ave Unit 275
- 3850 Atlantic Ave Unit 296
- 3850 Atlantic Ave Unit 257
- 3850 Atlantic Ave Unit 27
- 28017 Atlantic Ave
- 27991 Atlantic Ave
- 27996 Millar St
- 28014 Millar St
- 28031 Atlantic Ave
- 27984 Millar St
- 28024 Millar St
- 28004 Atlantic Ave
- 27966 Millar St
- 28018 Atlantic Ave
- 28034 Millar St
- 28043 Atlantic Ave
- 27982 Atlantic Ave
- 28032 Atlantic Ave
- 28046 Millar St
- 28003 Millar St
- 28011 Millar St
- 27994 Atlantic Ave
- 27989 Millar St
- 28019 Millar St