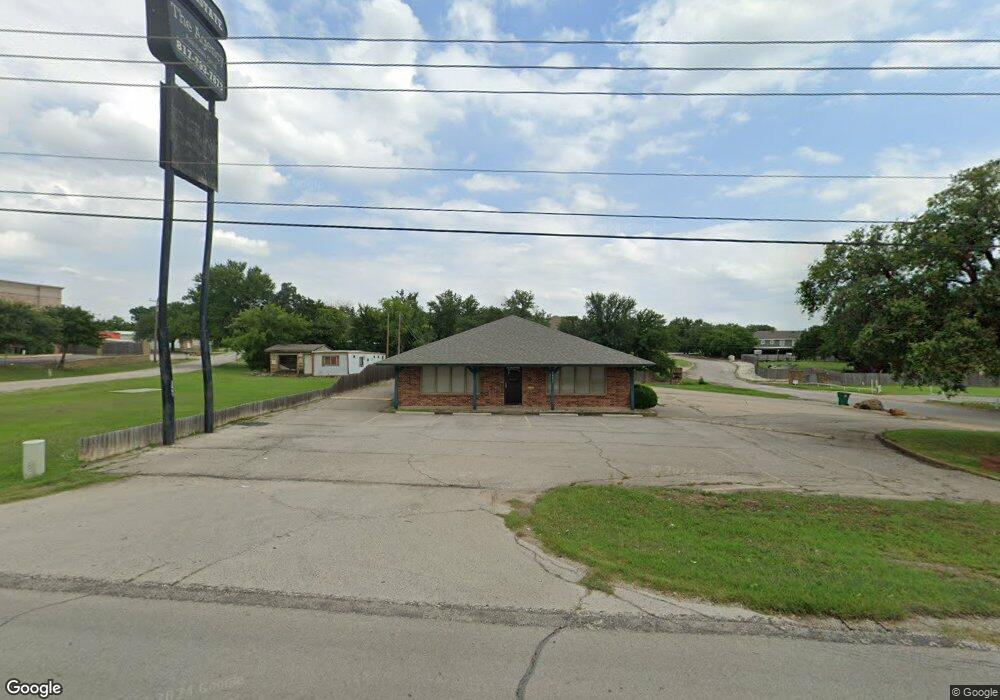
2801 E Us Highway 377 Granbury, TX 76049
Estimated Value: $466,829
--
Bed
--
Bath
2,880
Sq Ft
$162/Sq Ft
Est. Value
About This Home
This home is located at 2801 E Us Highway 377, Granbury, TX 76049 and is currently estimated at $466,829, approximately $162 per square foot. 2801 E Us Highway 377 is a home located in Hood County with nearby schools including Oak Woods School, Acton Middle School, and Granbury High School.
Ownership History
Date
Name
Owned For
Owner Type
Purchase Details
Closed on
Feb 25, 2021
Sold by
Wesson Roy Ene and Wesson Lola Sue
Bought by
Floroplus Investments Llc
Current Estimated Value
Home Financials for this Owner
Home Financials are based on the most recent Mortgage that was taken out on this home.
Original Mortgage
$297,500
Outstanding Balance
$171,053
Interest Rate
2.7%
Mortgage Type
Commercial
Estimated Equity
$295,776
Purchase Details
Closed on
Feb 24, 2021
Sold by
Wesson Irrevocable Trust and Wesson Roy Gene
Bought by
Floroplus Investments Llc
Home Financials for this Owner
Home Financials are based on the most recent Mortgage that was taken out on this home.
Original Mortgage
$297,500
Outstanding Balance
$171,053
Interest Rate
2.7%
Mortgage Type
Commercial
Estimated Equity
$295,776
Create a Home Valuation Report for This Property
The Home Valuation Report is an in-depth analysis detailing your home's value as well as a comparison with similar homes in the area
Home Values in the Area
Average Home Value in this Area
Purchase History
| Date | Buyer | Sale Price | Title Company |
|---|---|---|---|
| Floroplus Investments Llc | -- | None Available | |
| Floroplus Investments Llc | -- | None Listed On Document |
Source: Public Records
Mortgage History
| Date | Status | Borrower | Loan Amount |
|---|---|---|---|
| Open | Floroplus Investments Llc | $297,500 | |
| Closed | Floroplus Investments Llc | $297,500 |
Source: Public Records
Tax History Compared to Growth
Tax History
| Year | Tax Paid | Tax Assessment Tax Assessment Total Assessment is a certain percentage of the fair market value that is determined by local assessors to be the total taxable value of land and additions on the property. | Land | Improvement |
|---|---|---|---|---|
| 2025 | $7,082 | $495,980 | $253,000 | $242,980 |
| 2024 | $5,968 | $372,560 | $126,500 | $246,060 |
| 2023 | $6,066 | $378,710 | $126,500 | $252,210 |
| 2022 | $6,531 | $381,780 | $126,500 | $255,280 |
| 2021 | $6,290 | $325,700 | $126,500 | $199,200 |
| 2020 | $6,081 | $311,470 | $126,500 | $184,970 |
| 2019 | $6,946 | $343,010 | $149,500 | $193,510 |
| 2018 | $7,368 | $363,850 | $172,500 | $191,350 |
| 2017 | $8,010 | $387,000 | $195,500 | $191,500 |
| 2016 | $8,010 | $387,000 | $195,500 | $191,500 |
| 2015 | $3,141 | $148,700 | $115,000 | $33,700 |
| 2014 | $3,141 | $152,910 | $115,000 | $37,910 |
Source: Public Records
Map
Nearby Homes
- 157 Business Blvd
- 502 Shady Grove Dr
- 2231 Cobblestone Ct
- 3224 W Weems Ct
- 210 Davis Rd
- 704 Shady Grove Ct
- 3617 Fm-4 Tbd
- Residence 3 Plan at The Residences at Cardinal Woods
- Residence 5 Plan at The Residences at Cardinal Woods
- Residence 4 Plan at The Residences at Cardinal Woods
- Residence 1 Plan at The Residences at Cardinal Woods
- Residence 2 Plan at The Residences at Cardinal Woods
- 2009 Rock Dr
- 1066 Ranch Vista Rd
- 1055 Ranch Vista Rd
- 2007 Wigeon St
- 420 Crestline Dr
- 513 Crestline Dr
- 615 Whisperview Cir
- 646 Whisperview Cir
- 2715 E Us Highway 377
- 2715 E U S Highway 377
- 201 Shady Grove Dr
- 203 Shady Grove Dr
- 405 Westpark Ln
- 401 Westpark Ln
- 304 Westpark Ln
- 300 Westpark Ln
- 3301 E Us Highway 377 Unit 100
- 3301 E Us Highway 377
- 209 Shady Grove Dr
- 217 Shady Grove Dr
- 211 Shady Grove Dr
- 213 Shady Grove Dr
- 2800 E Us Highway 377
- 301 Shady Grove Dr
- 301 Shady Grove Dr Unit B
- 301 Shady Grove Dr Unit C
- 301 Shady Grove Dr Unit A
- 301 Shady Grove Dr Unit D