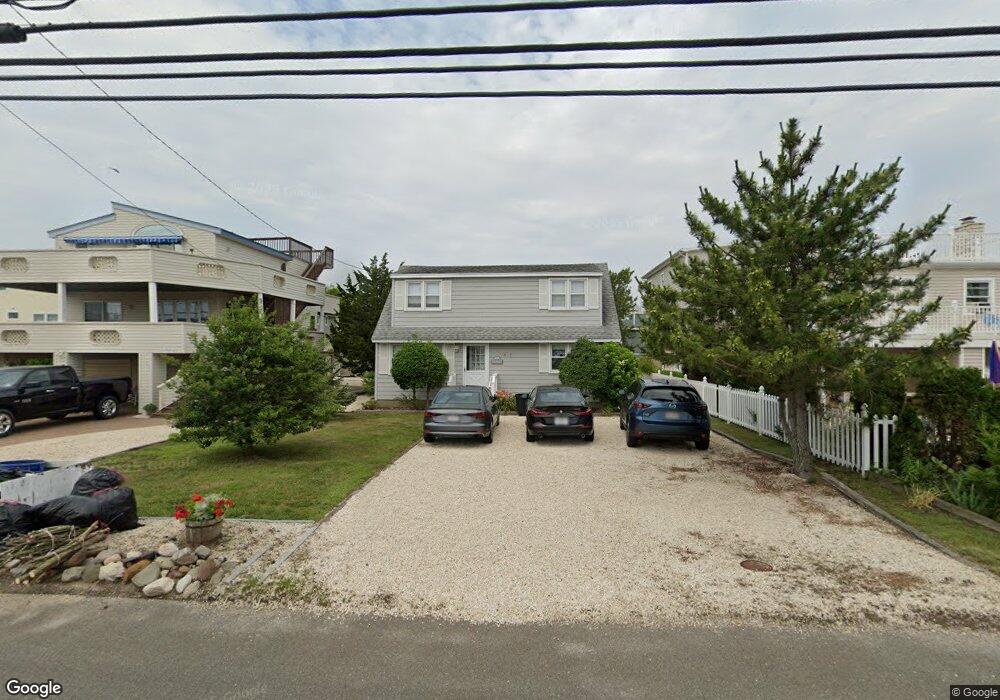
2803 Central Ave Barnegat Light, NJ 08006
Long Beach Island NeighborhoodEstimated Value: $1,181,853 - $1,670,000
4
Beds
1
Bath
1,536
Sq Ft
$964/Sq Ft
Est. Value
About This Home
This home is located at 2803 Central Ave, Barnegat Light, NJ 08006 and is currently estimated at $1,480,213, approximately $963 per square foot. 2803 Central Ave is a home with nearby schools including Ethel A. Jacobsen Elementary School, Long Beach Island Grade School, and Southern Regional Middle School.
Ownership History
Date
Name
Owned For
Owner Type
Purchase Details
Closed on
Sep 27, 2019
Sold by
Banks Cynthia Mary O and Watson Beth Ann
Bought by
Banks Cynthia Mary O and Skea Kathleen Holly
Current Estimated Value
Purchase Details
Closed on
Mar 12, 2009
Sold by
Skea Graham M
Bought by
Graham M Skea Living Trust and Obanks Cynthia Mary
Purchase Details
Closed on
Jun 13, 2008
Sold by
Skea Graham M and Skea Shirley A
Bought by
Skea Graham M
Create a Home Valuation Report for This Property
The Home Valuation Report is an in-depth analysis detailing your home's value as well as a comparison with similar homes in the area
Home Values in the Area
Average Home Value in this Area
Purchase History
| Date | Buyer | Sale Price | Title Company |
|---|---|---|---|
| Banks Cynthia Mary O | -- | None Available | |
| Graham M Skea Living Trust | -- | None Available | |
| Skea Graham M | -- | None Available |
Source: Public Records
Tax History Compared to Growth
Tax History
| Year | Tax Paid | Tax Assessment Tax Assessment Total Assessment is a certain percentage of the fair market value that is determined by local assessors to be the total taxable value of land and additions on the property. | Land | Improvement |
|---|---|---|---|---|
| 2025 | $5,988 | $594,000 | $425,000 | $169,000 |
| 2024 | $5,293 | $594,000 | $425,000 | $169,000 |
| 2023 | $4,912 | $594,000 | $425,000 | $169,000 |
| 2022 | $4,912 | $594,000 | $425,000 | $169,000 |
| 2021 | $5,287 | $594,000 | $425,000 | $169,000 |
| 2020 | $5,364 | $594,000 | $425,000 | $169,000 |
| 2019 | $5,168 | $594,000 | $425,000 | $169,000 |
| 2018 | $5,079 | $594,000 | $425,000 | $169,000 |
| 2017 | $5,257 | $594,000 | $425,000 | $169,000 |
| 2016 | $5,120 | $594,000 | $425,000 | $169,000 |
| 2015 | $4,936 | $594,000 | $425,000 | $169,000 |
| 2014 | $5,370 | $594,000 | $425,000 | $169,000 |
Source: Public Records
Map
Nearby Homes