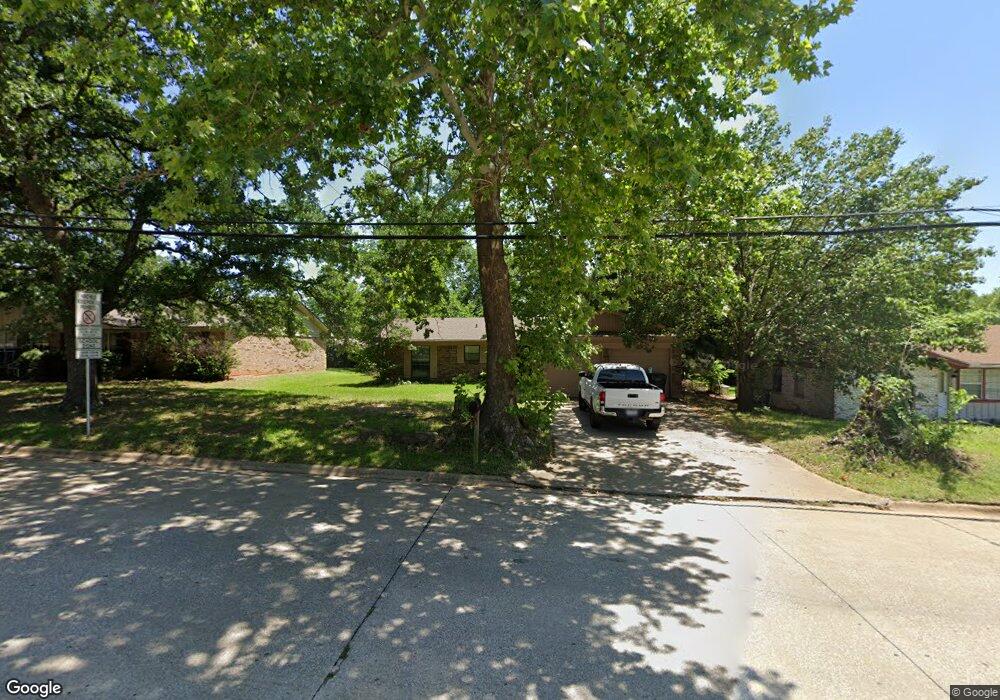
2806 W Crawford St Denison, TX 75020
Estimated Value: $199,102 - $233,000
3
Beds
2
Baths
1,148
Sq Ft
$188/Sq Ft
Est. Value
About This Home
This home is located at 2806 W Crawford St, Denison, TX 75020 and is currently estimated at $216,051, approximately $188 per square foot. 2806 W Crawford St is a home located in Grayson County with nearby schools including Mayes Elementary School, Scott Middle School, and Denison High School.
Ownership History
Date
Name
Owned For
Owner Type
Purchase Details
Closed on
Sep 14, 2016
Sold by
Shch Holdings Lp
Bought by
Equity Trust Co and Fredette Paul Craig
Current Estimated Value
Purchase Details
Closed on
Mar 19, 2014
Sold by
Pearce James S and Pearce Claudia
Bought by
Shch Holdings Lp
Purchase Details
Closed on
Jan 22, 2009
Sold by
Secretary Of Housing & Urban Development
Bought by
Pearce James C
Purchase Details
Closed on
Sep 4, 2008
Sold by
Countrywide Home Loans Inc
Bought by
Hud
Purchase Details
Closed on
Sep 2, 2008
Sold by
Perez David G and Perez Amanda L
Bought by
Countrywide Home Loans Inc
Purchase Details
Closed on
Sep 20, 2004
Sold by
Franklin Aaron M and Franklin Erin
Bought by
Perez David G and Perez Amanda L
Home Financials for this Owner
Home Financials are based on the most recent Mortgage that was taken out on this home.
Original Mortgage
$80,364
Interest Rate
5.86%
Mortgage Type
FHA
Create a Home Valuation Report for This Property
The Home Valuation Report is an in-depth analysis detailing your home's value as well as a comparison with similar homes in the area
Home Values in the Area
Average Home Value in this Area
Purchase History
| Date | Buyer | Sale Price | Title Company |
|---|---|---|---|
| Equity Trust Co | -- | Grayson County Title | |
| Shch Holdings Lp | -- | Freedom Title | |
| Pearce James C | -- | None Available | |
| Hud | -- | None Available | |
| Countrywide Home Loans Inc | $80,705 | None Available | |
| Perez David G | -- | -- |
Source: Public Records
Mortgage History
| Date | Status | Borrower | Loan Amount |
|---|---|---|---|
| Previous Owner | Perez David G | $80,364 |
Source: Public Records
Tax History Compared to Growth
Tax History
| Year | Tax Paid | Tax Assessment Tax Assessment Total Assessment is a certain percentage of the fair market value that is determined by local assessors to be the total taxable value of land and additions on the property. | Land | Improvement |
|---|---|---|---|---|
| 2025 | $4,778 | $212,670 | $53,132 | $159,538 |
| 2024 | $4,778 | $205,659 | $44,958 | $160,701 |
| 2023 | $4,672 | $206,199 | $43,851 | $162,348 |
| 2022 | $4,246 | $178,698 | $43,851 | $134,847 |
| 2021 | $3,633 | $144,049 | $31,334 | $112,715 |
| 2020 | $3,766 | $142,768 | $17,200 | $125,568 |
| 2019 | $3,876 | $140,858 | $17,200 | $123,658 |
| 2018 | $3,554 | $128,101 | $14,220 | $113,881 |
| 2017 | $3,018 | $107,873 | $12,432 | $95,441 |
| 2016 | $2,585 | $92,401 | $12,261 | $80,140 |
| 2015 | $2,058 | $72,849 | $8,174 | $64,675 |
| 2014 | $1,993 | $70,561 | $8,174 | $62,387 |
Source: Public Records
Map
Nearby Homes
- 22 Haven Cir
- 16 Haven Cir
- 800 Glen Key St
- 813 Glen Key St
- 631 Kerby Dr
- 131 S Imperial Dr
- 44 Haven Cir
- 2396 Miller St
- 2380 Miller St
- 2389 Miller St
- 2413 Miller St
- 2381 Miller St
- 2373 Miller St
- 2400 Miller St
- 922 S Hyde Park Ave
- 2404 Miller St
- 2385 Miller St
- 12 Village Green Ct
- 2603 Brookhaven Dr
- 110 S Hickory Ave
- 2812 W Crawford St
- 2800 W Crawford St
- 2807 Hyde Park Cir
- 2813 Hyde Park Cir
- 2818 W Crawford St
- 2801 Hyde Park Cir
- 2820 Hyde Park Cir
- 606 S Hyde Park Ave
- 600 S Hyde Park Ave
- 612 S Hyde Park Ave
- 618 S Hyde Park Ave
- 2818 Hyde Park Cir
- 2806 Hyde Park Cir
- 2800 Hyde Park Cir
- 2824 W Crawford St
- 2812 Hyde Park Cir
- 624 S Hyde Park Ave
- 2731 W Crawford St
- 630 S Hyde Park Ave
- 2807 W Day St