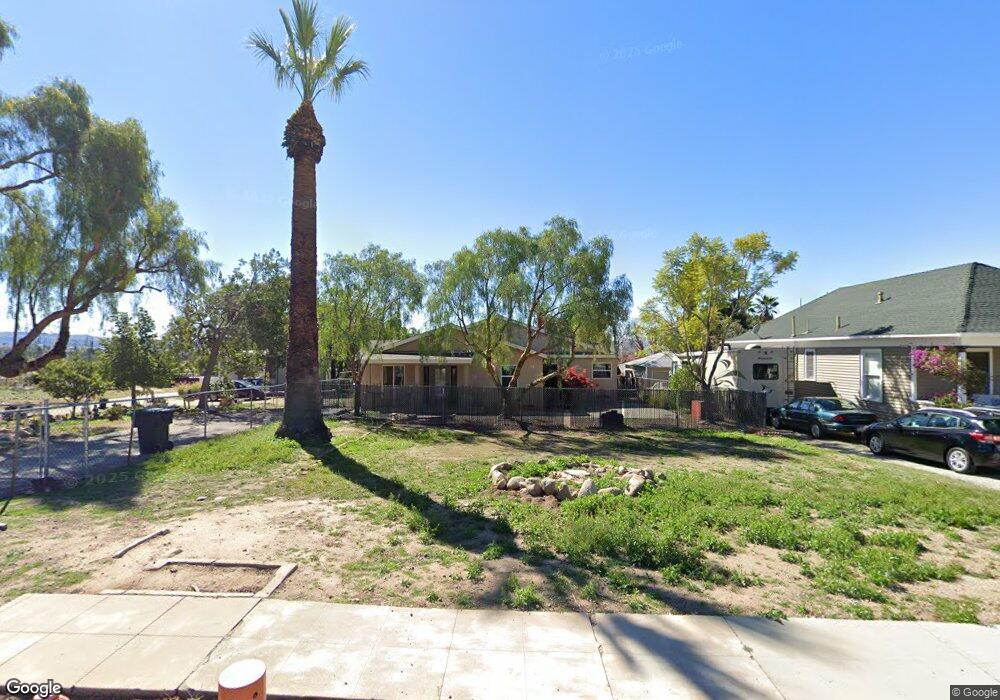
28063 Atlantic Ave Highland, CA 92346
East Highlands NeighborhoodEstimated Value: $576,000 - $663,000
3
Beds
2
Baths
2,223
Sq Ft
$282/Sq Ft
Est. Value
About This Home
This home is located at 28063 Atlantic Ave, Highland, CA 92346 and is currently estimated at $627,223, approximately $282 per square foot. 28063 Atlantic Ave is a home located in San Bernardino County with nearby schools including Thompson Elementary School, Serrano Middle School, and San Gorgonio High School.
Ownership History
Date
Name
Owned For
Owner Type
Purchase Details
Closed on
Jan 15, 2021
Sold by
Polansky Arthur S and Polansky Mary Ann
Bought by
Mary Ann And Arthur Polansky 2010 Trust and Polansky
Current Estimated Value
Home Financials for this Owner
Home Financials are based on the most recent Mortgage that was taken out on this home.
Original Mortgage
$230,500
Interest Rate
2.9%
Mortgage Type
New Conventional
Purchase Details
Closed on
Oct 7, 2010
Sold by
Polansky Art S and Polansky Mary Ann
Bought by
Polansky Mary Ann and Polansky Arthur S
Purchase Details
Closed on
Apr 25, 1999
Sold by
Polansky Mary Ann
Bought by
Polansky Art
Purchase Details
Closed on
Apr 22, 1999
Sold by
Mcallister Tony A
Bought by
Polansky Art
Purchase Details
Closed on
Aug 31, 1998
Sold by
Polansky Art
Bought by
Polansky Cody
Create a Home Valuation Report for This Property
The Home Valuation Report is an in-depth analysis detailing your home's value as well as a comparison with similar homes in the area
Home Values in the Area
Average Home Value in this Area
Purchase History
| Date | Buyer | Sale Price | Title Company |
|---|---|---|---|
| Mary Ann And Arthur Polansky 2010 Trust | -- | None Listed On Document | |
| Polansky Arthur S | -- | None Listed On Document | |
| Polansky Mary Ann | -- | None Available | |
| Polansky Art | -- | Commonwealth Land Title Co | |
| Polansky Art | $42,000 | Commonwealth Land Title Co | |
| Polansky Cody | -- | -- |
Source: Public Records
Mortgage History
| Date | Status | Borrower | Loan Amount |
|---|---|---|---|
| Previous Owner | Polansky Arthur S | $230,500 |
Source: Public Records
Tax History Compared to Growth
Tax History
| Year | Tax Paid | Tax Assessment Tax Assessment Total Assessment is a certain percentage of the fair market value that is determined by local assessors to be the total taxable value of land and additions on the property. | Land | Improvement |
|---|---|---|---|---|
| 2025 | $2,468 | $172,520 | $91,370 | $81,150 |
| 2024 | $2,468 | $169,137 | $89,578 | $79,559 |
| 2023 | $2,416 | $165,821 | $87,822 | $77,999 |
| 2022 | $2,413 | $162,570 | $86,100 | $76,470 |
| 2021 | $2,374 | $159,383 | $84,412 | $74,971 |
| 2020 | $2,364 | $157,748 | $83,546 | $74,202 |
| 2019 | $2,282 | $154,655 | $81,908 | $72,747 |
| 2018 | $2,189 | $151,623 | $80,302 | $71,321 |
| 2017 | $1,877 | $148,650 | $78,727 | $69,923 |
| 2016 | $1,820 | $145,735 | $77,183 | $68,552 |
| 2015 | $1,800 | $139,606 | $76,024 | $63,582 |
| 2014 | $1,750 | $136,872 | $74,535 | $62,337 |
Source: Public Records
Map
Nearby Homes
- 27953 Atlantic Ave
- 27875 Rainbow Ln
- 27888 Rainbow Ln
- 28037 Clifton St
- 28370 Coachman Ln
- 6941 La Praix St
- 0 La Praix St
- 27600 Atlantic Ave Unit 427
- 28390 Burns Ave
- 4040 Piedmont Dr Unit 81
- 4040 Piedmont Dr Unit 289
- 4040 Piedmont Dr Unit 297
- 4040 Piedmont Dr Unit 283
- 4040 Piedmont Dr Unit 113
- 27856 Fieldstone Dr
- 7001 Church Ave Unit 5
- 3850 Atlantic Ave Unit 58
- 3850 Atlantic Ave Unit 217
- 3850 Atlantic Ave Unit 275
- 3850 Atlantic Ave Unit 296
- 28057 Atlantic Ave
- 28043 Atlantic Ave
- 28080 Atlantic Ave
- 6723 Grove Ave
- 28046 Millar St
- 28031 Atlantic Ave
- 28034 Millar St
- 6735 Grove Ave
- 28062 Atlantic Ave
- 28070 Atlantic Ave
- 28042 Atlantic Ave
- 28024 Millar St
- 6745 Grove Ave
- 28032 Atlantic Ave
- 28017 Atlantic Ave
- 28039 Millar St
- 28014 Millar St
- 6757 Grove Ave
- 28029 Millar St
- 28003 Atlantic Ave