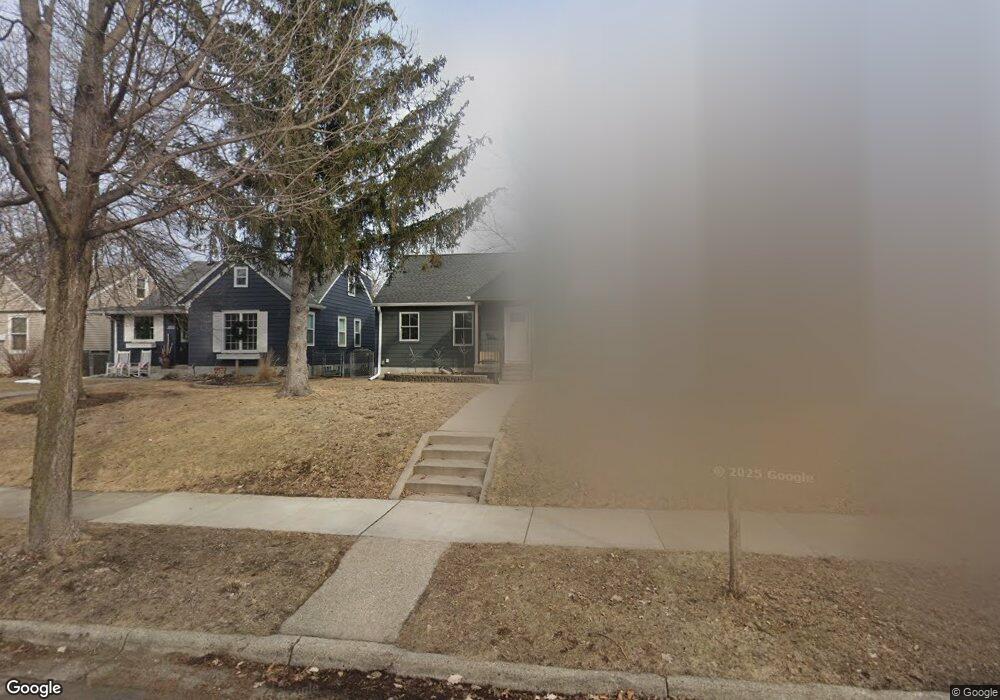
2809 Jersey Ave S Saint Louis Park, MN 55426
Bronx Park NeighborhoodEstimated Value: $371,265 - $428,000
3
Beds
1
Bath
1,181
Sq Ft
$340/Sq Ft
Est. Value
About This Home
This home is located at 2809 Jersey Ave S, Saint Louis Park, MN 55426 and is currently estimated at $401,816, approximately $340 per square foot. 2809 Jersey Ave S is a home located in Hennepin County with nearby schools including Peter Hobart Elementary School, St. Louis Park Middle School, and St. Louis Park High School.
Ownership History
Date
Name
Owned For
Owner Type
Purchase Details
Closed on
Oct 25, 2019
Sold by
Valley Benjamin
Bought by
Kudlik D Anne
Current Estimated Value
Home Financials for this Owner
Home Financials are based on the most recent Mortgage that was taken out on this home.
Original Mortgage
$269,794
Outstanding Balance
$236,835
Interest Rate
3.6%
Mortgage Type
New Conventional
Estimated Equity
$164,981
Purchase Details
Closed on
Jun 7, 2018
Sold by
Garcia Carlos A
Bought by
Valley Benjamin and Kudlik Danne
Home Financials for this Owner
Home Financials are based on the most recent Mortgage that was taken out on this home.
Original Mortgage
$266,400
Interest Rate
4.6%
Mortgage Type
New Conventional
Purchase Details
Closed on
May 27, 2004
Sold by
Ekstrand Molly J
Bought by
Garcia Carlos A and Garcia Heather R
Purchase Details
Closed on
Jun 27, 1997
Sold by
Sutter Ronald A and Sutter Helen M
Bought by
Wilson Molly J and Ekstrand Eric S
Create a Home Valuation Report for This Property
The Home Valuation Report is an in-depth analysis detailing your home's value as well as a comparison with similar homes in the area
Home Values in the Area
Average Home Value in this Area
Purchase History
| Date | Buyer | Sale Price | Title Company |
|---|---|---|---|
| Kudlik D Anne | -- | Executive Title | |
| Valley Benjamin | $296,000 | Titlesmart Inc | |
| Garcia Carlos A | $246,000 | -- | |
| Wilson Molly J | $111,500 | -- |
Source: Public Records
Mortgage History
| Date | Status | Borrower | Loan Amount |
|---|---|---|---|
| Open | Kudlik D Anne | $269,794 | |
| Previous Owner | Valley Benjamin | $266,400 |
Source: Public Records
Tax History Compared to Growth
Tax History
| Year | Tax Paid | Tax Assessment Tax Assessment Total Assessment is a certain percentage of the fair market value that is determined by local assessors to be the total taxable value of land and additions on the property. | Land | Improvement |
|---|---|---|---|---|
| 2024 | $4,666 | $346,300 | $129,100 | $217,200 |
| 2023 | $4,447 | $339,600 | $126,600 | $213,000 |
| 2022 | $3,944 | $339,000 | $126,000 | $213,000 |
| 2021 | $3,805 | $303,300 | $109,600 | $193,700 |
| 2020 | $3,707 | $296,200 | $104,400 | $191,800 |
| 2019 | $3,519 | $278,800 | $99,500 | $179,300 |
| 2018 | $3,493 | $257,800 | $94,800 | $163,000 |
| 2017 | $3,031 | $225,400 | $75,000 | $150,400 |
| 2016 | $3,139 | $224,900 | $67,800 | $157,100 |
| 2015 | $2,930 | $206,300 | $63,400 | $142,900 |
| 2014 | -- | $189,400 | $60,100 | $129,300 |
Source: Public Records
Map
Nearby Homes
- 2849 Jersey Ave S
- 2732 Idaho Ave S
- 2852 Hampshire Ave S
- 2700 Georgia Ave S
- 2925 Georgia Ave S
- 2622 Idaho Ave S
- 2620 Kentucky Ave S
- 2608 Kentucky Ave S
- 7217 Minnetonka Blvd
- 2910 Edgewood Ave S
- 2707 Edgewood Ave S
- 2744 Dakota Ave S
- 6821 W 24th St
- 3056 Florida Ave S
- 6926 W 24th St
- 3101 Nevada Ave S
- 3131 Georgia Ave S
- 3124 Maryland Ave S
- 2736 Brunswick Ave S
- 2813 Brunswick Ave S
- 2805 Jersey Ave S
- 2813 Jersey Ave S
- 2801 Jersey Ave S
- 2801 Jersey Ave S
- 2817 Jersey Ave S
- 2812 2812 Jersey-Avenue-s
- 2821 Jersey Ave S
- 2808 Idaho Ave S
- 2804 Idaho Ave S
- 2812 Idaho Ave S
- 2821 2821 Jersey Ave S
- 2825 Jersey Ave S
- 2808 Idaho Ave S
- 2800 Idaho Ave S
- 2816 Idaho Ave S
- 2812 Jersey Ave S
- 2800 Idaho Ave S
- 2757 Jersey Ave S
- 2820 Idaho Ave S
- 2808 Jersey Ave S