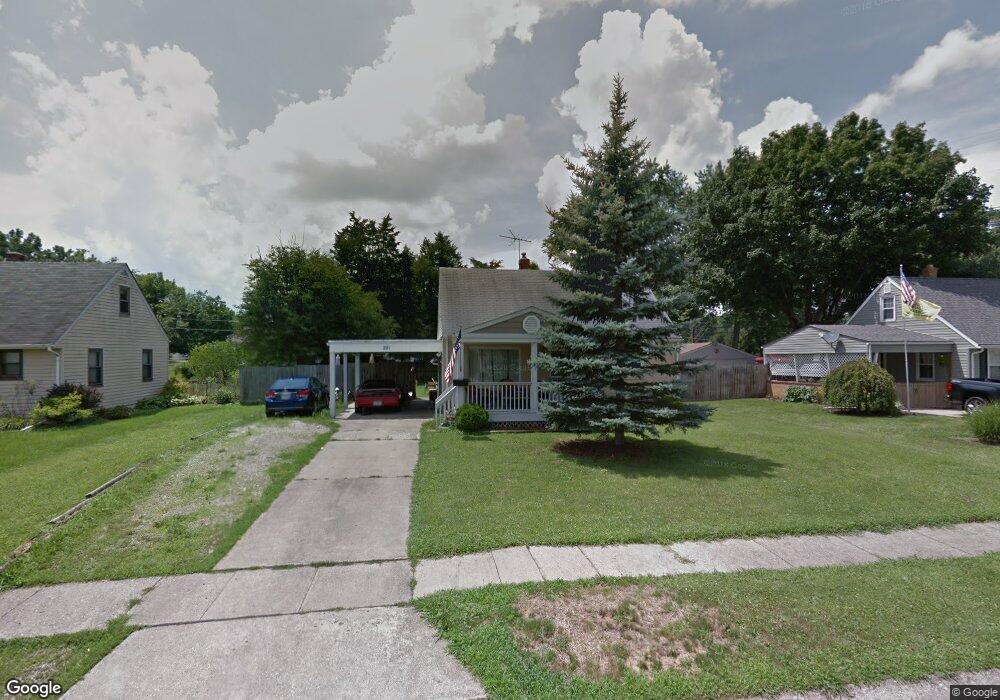
281 Hatherly Dr Hamilton, OH 45013
Estimated Value: $199,206 - $212,000
3
Beds
1
Bath
1,008
Sq Ft
$204/Sq Ft
Est. Value
About This Home
This home is located at 281 Hatherly Dr, Hamilton, OH 45013 and is currently estimated at $206,052, approximately $204 per square foot. 281 Hatherly Dr is a home located in Butler County with nearby schools including Brookwood Elementary School, Wilson Middle School, and Hamilton High School Main Campus.
Ownership History
Date
Name
Owned For
Owner Type
Purchase Details
Closed on
Nov 15, 2007
Sold by
Hartman Michael C and Hartman Carol
Bought by
Pies Tonya M and Pies Darryl D
Current Estimated Value
Home Financials for this Owner
Home Financials are based on the most recent Mortgage that was taken out on this home.
Original Mortgage
$98,500
Outstanding Balance
$62,064
Interest Rate
6.3%
Mortgage Type
Purchase Money Mortgage
Estimated Equity
$143,988
Purchase Details
Closed on
May 14, 2007
Sold by
Wells Fargo Bank Na
Bought by
Hartman Michael C
Purchase Details
Closed on
Feb 5, 2007
Sold by
Apgar Bobbie
Bought by
Wells Fargo Bank Na and Asset Backed Pass Through Certificates S
Purchase Details
Closed on
May 20, 1998
Sold by
Abner Louis G Tr
Bought by
Apgar Bobbie and Apgar Brenda J
Home Financials for this Owner
Home Financials are based on the most recent Mortgage that was taken out on this home.
Original Mortgage
$71,900
Interest Rate
7.13%
Mortgage Type
FHA
Create a Home Valuation Report for This Property
The Home Valuation Report is an in-depth analysis detailing your home's value as well as a comparison with similar homes in the area
Home Values in the Area
Average Home Value in this Area
Purchase History
| Date | Buyer | Sale Price | Title Company |
|---|---|---|---|
| Pies Tonya M | $98,500 | Attorney | |
| Hartman Michael C | $62,600 | Resource Title Agency Inc | |
| Wells Fargo Bank Na | $50,000 | None Available | |
| Apgar Bobbie | $72,000 | Superior Title Agency Inc |
Source: Public Records
Mortgage History
| Date | Status | Borrower | Loan Amount |
|---|---|---|---|
| Open | Pies Tonya M | $98,500 | |
| Previous Owner | Apgar Bobbie | $71,900 |
Source: Public Records
Tax History Compared to Growth
Tax History
| Year | Tax Paid | Tax Assessment Tax Assessment Total Assessment is a certain percentage of the fair market value that is determined by local assessors to be the total taxable value of land and additions on the property. | Land | Improvement |
|---|---|---|---|---|
| 2024 | $1,975 | $46,810 | $8,040 | $38,770 |
| 2023 | $1,966 | $47,680 | $8,040 | $39,640 |
| 2022 | $1,689 | $34,020 | $8,040 | $25,980 |
| 2021 | $1,491 | $32,930 | $8,040 | $24,890 |
| 2020 | $1,554 | $32,930 | $8,040 | $24,890 |
| 2019 | $1,964 | $26,820 | $8,490 | $18,330 |
| 2018 | $1,247 | $26,820 | $8,490 | $18,330 |
| 2017 | $1,257 | $26,820 | $8,490 | $18,330 |
| 2016 | $1,212 | $24,640 | $8,490 | $16,150 |
| 2015 | $1,205 | $24,640 | $8,490 | $16,150 |
| 2014 | $1,624 | $24,640 | $8,490 | $16,150 |
| 2013 | $1,624 | $35,340 | $11,330 | $24,010 |
Source: Public Records
Map
Nearby Homes
- 885 Carlisle Ave
- 1415 Main St
- 82 N Brookwood Ave
- 560 Springvale Dr
- 16 Rockford Dr
- 1317 Glenbrook Dr
- 781 Springvale Dr
- 55 Cove Ct
- 75 Waterpoint Ln
- 1317 Goodman Ave
- 5 Waterview Ct Unit 30
- 1350 Stahlheber Rd
- 1311 Park Ave
- 1150 Franklin St
- 2073 Sunset Dr
- 1210 Stephanie Dr
- 1210 Stephanie Dr Unit 3
- 1263 Park Ave
- 1028 Ross Ave
- 1593 Eden Park Dr
- 265 Hatherly Dr
- 295 Hatherly Dr
- 280 Westfield Ave
- 266 Westfield Ave
- 251 Hatherly Dr
- 296 Westfield Ave
- 280 Hatherly Dr
- 266 Hatherly Dr
- 250 Westfield Ave
- 296 Hatherly Dr
- 250 Hatherly Dr
- 235 Hatherly Dr
- 930 Stahlheber Rd
- 930 Stahlheber Rd
- 950 Stahlheber Rd
- 234 Westfield Ave
- 234 Hatherly Dr
- 956 Stahlheber Rd
- 221 Hatherly Dr
- 281 Westfield Ave