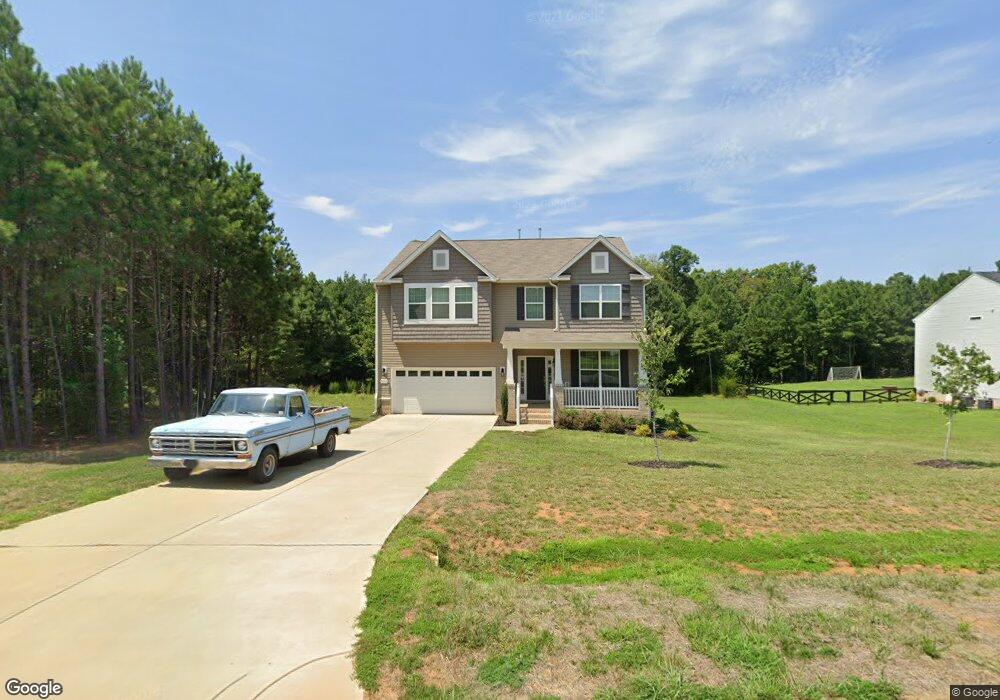
2810 Shiloh Stone Ct Burlington, NC 27215
Estimated Value: $497,710 - $548,000
4
Beds
3
Baths
2,826
Sq Ft
$185/Sq Ft
Est. Value
About This Home
This home is located at 2810 Shiloh Stone Ct, Burlington, NC 27215 and is currently estimated at $521,428, approximately $184 per square foot. 2810 Shiloh Stone Ct is a home located in Alamance County with nearby schools including Edwin M. Holt Elementary School, Southern Alamance Middle School, and Southern Alamance High School.
Ownership History
Date
Name
Owned For
Owner Type
Purchase Details
Closed on
Jul 8, 2019
Sold by
Windsor Investments Llc
Bought by
Enoch Lakeisha Nicole and Enoch Edward Nathaniel
Current Estimated Value
Home Financials for this Owner
Home Financials are based on the most recent Mortgage that was taken out on this home.
Original Mortgage
$270,182
Outstanding Balance
$236,704
Interest Rate
3.82%
Estimated Equity
$284,724
Purchase Details
Closed on
Nov 8, 2018
Sold by
Sgrm Inc
Bought by
Windsor Investments Llc
Purchase Details
Closed on
Jun 23, 2016
Sold by
The Estate Of A H Patterson Jr Deceased
Bought by
Sgrm Inc
Home Financials for this Owner
Home Financials are based on the most recent Mortgage that was taken out on this home.
Original Mortgage
$345,000
Interest Rate
3.58%
Create a Home Valuation Report for This Property
The Home Valuation Report is an in-depth analysis detailing your home's value as well as a comparison with similar homes in the area
Home Values in the Area
Average Home Value in this Area
Purchase History
| Date | Buyer | Sale Price | Title Company |
|---|---|---|---|
| Enoch Lakeisha Nicole | $288,000 | Attorney | |
| Windsor Investments Llc | $38,000 | None Available | |
| Sgrm Inc | $345,000 | Attorney |
Source: Public Records
Mortgage History
| Date | Status | Borrower | Loan Amount |
|---|---|---|---|
| Open | Enoch Lakeisha Nicole | $270,182 | |
| Previous Owner | Sgrm Inc | $345,000 |
Source: Public Records
Tax History Compared to Growth
Tax History
| Year | Tax Paid | Tax Assessment Tax Assessment Total Assessment is a certain percentage of the fair market value that is determined by local assessors to be the total taxable value of land and additions on the property. | Land | Improvement |
|---|---|---|---|---|
| 2025 | $2,863 | $474,611 | $40,000 | $434,611 |
| 2024 | $2,602 | $474,611 | $40,000 | $434,611 |
| 2023 | $2,530 | $497,486 | $40,000 | $457,486 |
| 2022 | $1,977 | $258,865 | $28,616 | $230,249 |
| 2021 | $2,003 | $258,865 | $28,616 | $230,249 |
| 2020 | $2,028 | $258,865 | $28,616 | $230,249 |
| 2019 | $53 | $28,616 | $28,616 | $0 |
| 2018 | $0 | $28,616 | $28,616 | $0 |
| 2017 | $2,222 | $318,540 | $318,540 | $0 |
| 2016 | $2,282 | $331,877 | $274,301 | $57,576 |
| 2015 | $658 | $96,207 | $38,631 | $57,576 |
| 2014 | -- | $96,207 | $38,631 | $57,576 |
Source: Public Records
Map
Nearby Homes
- 2440 Gardner Holt Rd
- 1334 Bellemont Ln
- 287 Thistle Downs Dr
- 1108 Aster Way
- 2834 Bellemont Alamance Rd
- 1666 Whites Kennel Rd
- 1666 Whites Kennel Rd
- 3567 Bellemont Mount Hermon Rd
- 3113 Cullens Dr
- 3109 Cullens Dr
- 4470 S Nc Highway 62
- 3902 Chucks Ct
- 4053 Friendship Patterson Mill Rd
- 4459 S Nc Highway 62
- 2165 MacKenna Dr
- 2363 Whelen Dr
- 2374 Whelen Dr
- 2816 Shiloh Stone Ct Unit LOT 9LR
- 2816 Shiloh Stone Ct
- 2822 Shiloh Stone Ct
- 2811 Shiloh Stone Ct
- 2815 Shiloh Stone Ct
- 2821 Shiloh Stone Ct Unit LOT 26 LR
- 2821 Shiloh Stone Ct
- 2828 Shiloh Stone Ct
- 2803 Shiloh Stone Ct
- 2834 Shiloh Stone Ct
- 2023 Bellemont Alamance Rd
- 2839 Shiloh Stone Ct
- 2029 Bellemont Alamance Rd
- 1989 Bellemont-Alamance Rd
- 1975 Bellemont Alamance Rd
- 1989 Bellemont Alamance Rd
- 2840 Shiloh Stone Ct
- 2035 Bellemont Alamance Rd Unit (Lot 6 LR)
- 2035 Bellemont Alamance Rd
- 1969 Bellemont Alamance Rd