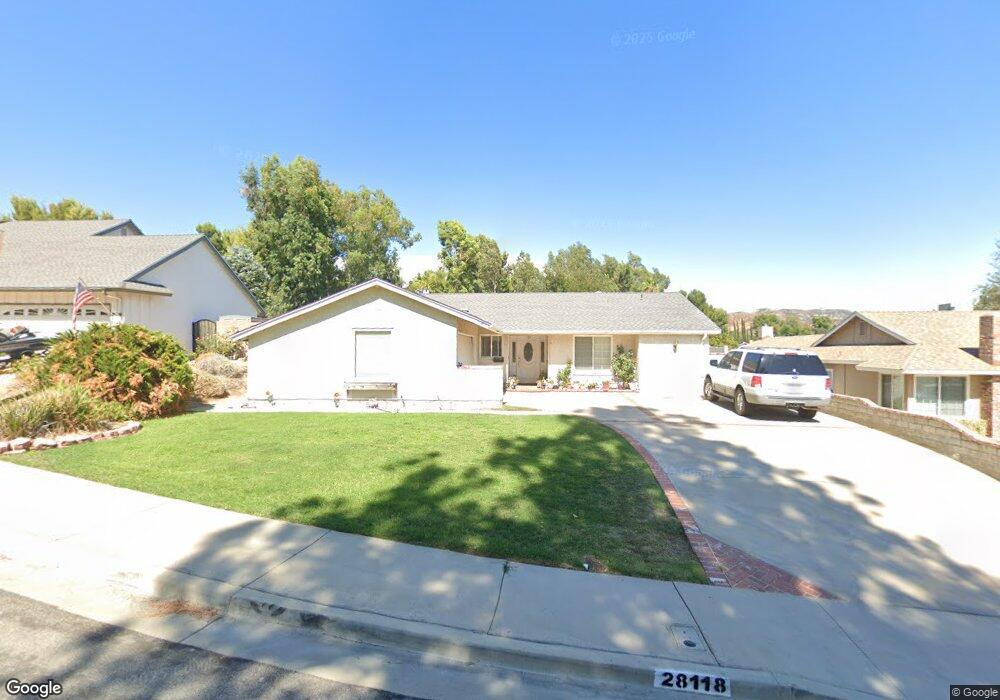
28118 Lodestar Dr Santa Clarita, CA 91350
Saugus NeighborhoodEstimated Value: $766,216 - $808,000
3
Beds
2
Baths
1,782
Sq Ft
$441/Sq Ft
Est. Value
About This Home
This home is located at 28118 Lodestar Dr, Santa Clarita, CA 91350 and is currently estimated at $785,804, approximately $440 per square foot. 28118 Lodestar Dr is a home located in Los Angeles County with nearby schools including Rosedell Elementary School, Arroyo Seco Junior High School, and Saugus High School.
Ownership History
Date
Name
Owned For
Owner Type
Purchase Details
Closed on
Feb 12, 2002
Sold by
Cheriegate William and Cheriegate Kathleen S
Bought by
Cheriegate William and Cheriegate Kathleen S
Current Estimated Value
Home Financials for this Owner
Home Financials are based on the most recent Mortgage that was taken out on this home.
Original Mortgage
$180,000
Outstanding Balance
$74,060
Interest Rate
6.99%
Estimated Equity
$711,744
Purchase Details
Closed on
Mar 15, 2000
Sold by
Cheriegate William and Cheriegate Kathy S
Bought by
Cheriegate William and Cheriegate Kathleen S
Purchase Details
Closed on
Apr 8, 1994
Sold by
Tyler Timothy D and Tyler Dianne
Bought by
Cheriegate William and Cheriegate Kathy S
Home Financials for this Owner
Home Financials are based on the most recent Mortgage that was taken out on this home.
Original Mortgage
$119,000
Interest Rate
7.79%
Create a Home Valuation Report for This Property
The Home Valuation Report is an in-depth analysis detailing your home's value as well as a comparison with similar homes in the area
Home Values in the Area
Average Home Value in this Area
Purchase History
| Date | Buyer | Sale Price | Title Company |
|---|---|---|---|
| Cheriegate William | -- | United Title Co | |
| Cheriegate William | -- | -- | |
| Cheriegate William | $139,000 | Gateway Title |
Source: Public Records
Mortgage History
| Date | Status | Borrower | Loan Amount |
|---|---|---|---|
| Open | Cheriegate William | $180,000 | |
| Closed | Cheriegate William | $119,000 |
Source: Public Records
Tax History Compared to Growth
Tax History
| Year | Tax Paid | Tax Assessment Tax Assessment Total Assessment is a certain percentage of the fair market value that is determined by local assessors to be the total taxable value of land and additions on the property. | Land | Improvement |
|---|---|---|---|---|
| 2025 | $4,176 | $268,721 | $126,271 | $142,450 |
| 2024 | $4,176 | $263,453 | $123,796 | $139,657 |
| 2023 | $3,944 | $258,288 | $121,369 | $136,919 |
| 2022 | $3,952 | $253,225 | $118,990 | $134,235 |
| 2021 | $3,880 | $248,260 | $116,657 | $131,603 |
| 2019 | $3,748 | $240,898 | $113,198 | $127,700 |
| 2018 | $3,576 | $236,176 | $110,979 | $125,197 |
| 2016 | $3,356 | $227,007 | $106,670 | $120,337 |
| 2015 | $3,231 | $223,598 | $105,068 | $118,530 |
| 2014 | $3,179 | $219,219 | $103,010 | $116,209 |
Source: Public Records
Map
Nearby Homes
- 28123 Bobwhite Cir Unit 104
- 27828 Parkvale Dr
- 28050 Devon Ln
- 21123 Avenida de Sonrisa
- 28303 Sycamore Dr
- 28340 Sycamore Dr
- 21560 Quinn Place
- 28016 Robin Ave
- 21741 Jeffers Ln
- 21558 Oak Dr Unit 78
- 20715 Dot St
- 21553 Oak Dr Unit 115
- 20906 Susan Carole Dr
- 21643 Masterson Ct
- 27620 Susan Beth Way Unit A
- 28011 Charles Dr
- 20818 Benz Rd
- 20623 Russ Jay St
- 21103 Cross Creek Dr
- 21240 Lone Star Way
- 28112 Lodestar Dr
- 28126 Lodestar Dr
- 28109 Juneda Dr
- 28102 Lodestar Dr
- 28117 Lodestar Dr
- 28111 Lodestar Dr
- 28112 Juneda Dr
- 28101 Juneda Dr
- 28127 Lodestar Dr
- 28103 Lodestar Dr
- 28118 Meadbury Dr
- 28108 Juneda Dr
- 28110 Meadbury Dr
- 21166 Altena Dr
- 21174 Altena Dr
- 28126 Meadbury Dr
- 21160 Altena Dr
- 28104 Meadbury Dr
- 21200 Altena Dr
- 28100 Juneda Dr