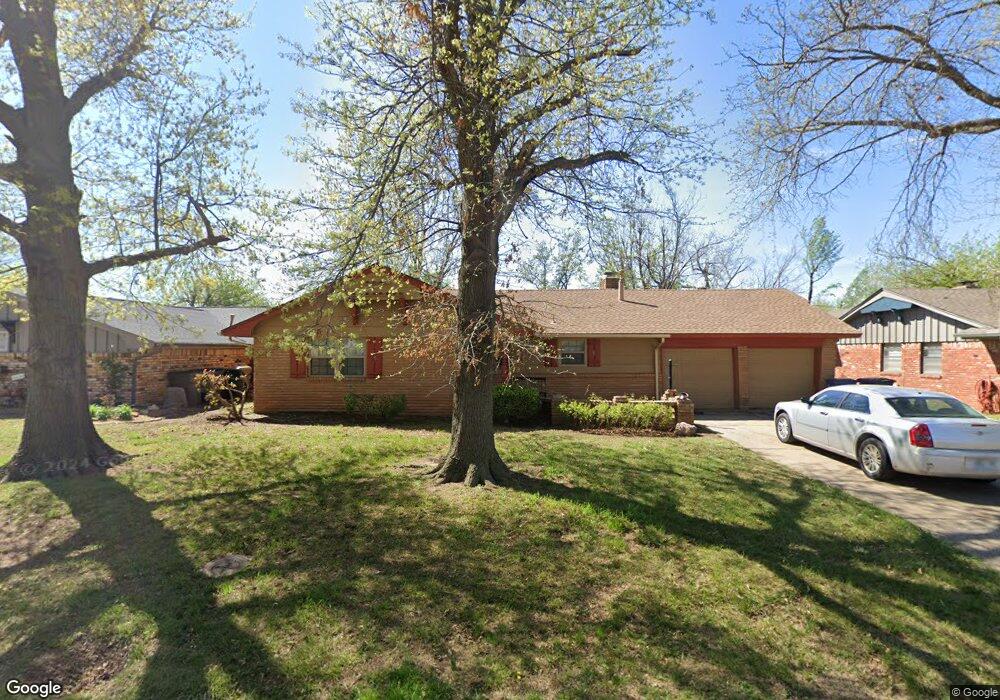
2812 Northampton Place Oklahoma City, OK 73120
Estimated Value: $197,000 - $217,299
3
Beds
2
Baths
1,427
Sq Ft
$145/Sq Ft
Est. Value
About This Home
This home is located at 2812 Northampton Place, Oklahoma City, OK 73120 and is currently estimated at $206,825, approximately $144 per square foot. 2812 Northampton Place is a home located in Oklahoma County with nearby schools including Ridgeview Elementary School, John Marshall Enterprise Middle School, and John Marshall Enterprise High School.
Ownership History
Date
Name
Owned For
Owner Type
Purchase Details
Closed on
Aug 9, 2025
Sold by
Jackson Hollow Investments Llc
Bought by
Redbird Properties And Design Llc
Current Estimated Value
Purchase Details
Closed on
Jan 10, 2025
Sold by
Hale Properties Llc
Bought by
Jackson Hollow Investments Llc
Home Financials for this Owner
Home Financials are based on the most recent Mortgage that was taken out on this home.
Original Mortgage
$176,400
Interest Rate
6.81%
Mortgage Type
Construction
Purchase Details
Closed on
Feb 21, 2005
Sold by
Stoner Kenneth M and Stoner Barbara C
Bought by
Hale Properties Llc
Purchase Details
Closed on
Nov 1, 2004
Sold by
Chappell Marti M and Marti M Chappell Revocable Tru
Bought by
Stoner Kenneth M and Stoner Barbara C
Create a Home Valuation Report for This Property
The Home Valuation Report is an in-depth analysis detailing your home's value as well as a comparison with similar homes in the area
Home Values in the Area
Average Home Value in this Area
Purchase History
| Date | Buyer | Sale Price | Title Company |
|---|---|---|---|
| Redbird Properties And Design Llc | $199,000 | None Listed On Document | |
| Redbird Properties And Design Llc | $199,000 | None Listed On Document | |
| Jackson Hollow Investments Llc | $155,000 | Chicago Title | |
| Jackson Hollow Investments Llc | $155,000 | Chicago Title | |
| Hale Properties Llc | -- | -- | |
| Stoner Kenneth M | -- | First American Title |
Source: Public Records
Mortgage History
| Date | Status | Borrower | Loan Amount |
|---|---|---|---|
| Previous Owner | Jackson Hollow Investments Llc | $176,400 |
Source: Public Records
Tax History Compared to Growth
Tax History
| Year | Tax Paid | Tax Assessment Tax Assessment Total Assessment is a certain percentage of the fair market value that is determined by local assessors to be the total taxable value of land and additions on the property. | Land | Improvement |
|---|---|---|---|---|
| 2024 | $2,325 | $20,322 | $3,710 | $16,612 |
| 2023 | $2,325 | $19,354 | $3,637 | $15,717 |
| 2022 | $2,124 | $18,433 | $3,159 | $15,274 |
| 2021 | $1,964 | $17,556 | $3,194 | $14,362 |
| 2020 | $1,845 | $16,720 | $3,261 | $13,459 |
| 2019 | $1,765 | $15,939 | $3,140 | $12,799 |
| 2018 | $1,596 | $15,180 | $0 | $0 |
| 2017 | $1,505 | $15,344 | $2,708 | $12,636 |
| 2016 | $1,454 | $14,739 | $2,708 | $12,031 |
| 2015 | $1,426 | $14,423 | $2,708 | $11,715 |
| 2014 | $1,396 | $14,188 | $2,733 | $11,455 |
Source: Public Records
Map
Nearby Homes
- 2924 Lakeside Dr
- 10405 Major Ave
- 2716 Tottingham Rd
- 10508 Whitehaven Rd
- 3009 Kent Dr
- 10512 Ridgeview Dr
- 2912 Carlton Way
- 4400 Redbud Ln
- 4424 Redbud Ln
- 2604 Keats Place
- 2604 Kings Way
- 2609 Huntleigh Dr
- 10816 Quail Cir
- 10813 Quail Cir
- 3012 Carlton Way
- 10900 Rock Ridge Rd
- 3120 Kent Dr
- 10416 Lakeside Dr
- 2455 Manchester Dr Unit 57
- 2455 Manchester Dr Unit 8
- 2808 Northampton Place
- 2816 Northampton Place
- 2813 Manchester Dr
- 2804 Northampton Place
- 2817 Manchester Dr
- 2809 Manchester Dr
- 2820 Northampton Place
- 2821 Manchester Dr
- 2817 Northampton Place
- 2805 Manchester Dr
- 2813 Northampton Place
- 2821 Northampton Place
- 2800 Northampton Place
- 2809 Northampton Place
- 2825 Manchester Dr
- 2801 Manchester Dr
- 2825 Northampton Place
- 2824 Northampton Place
- 2801 Northampton Place
- 2736 Northampton Place