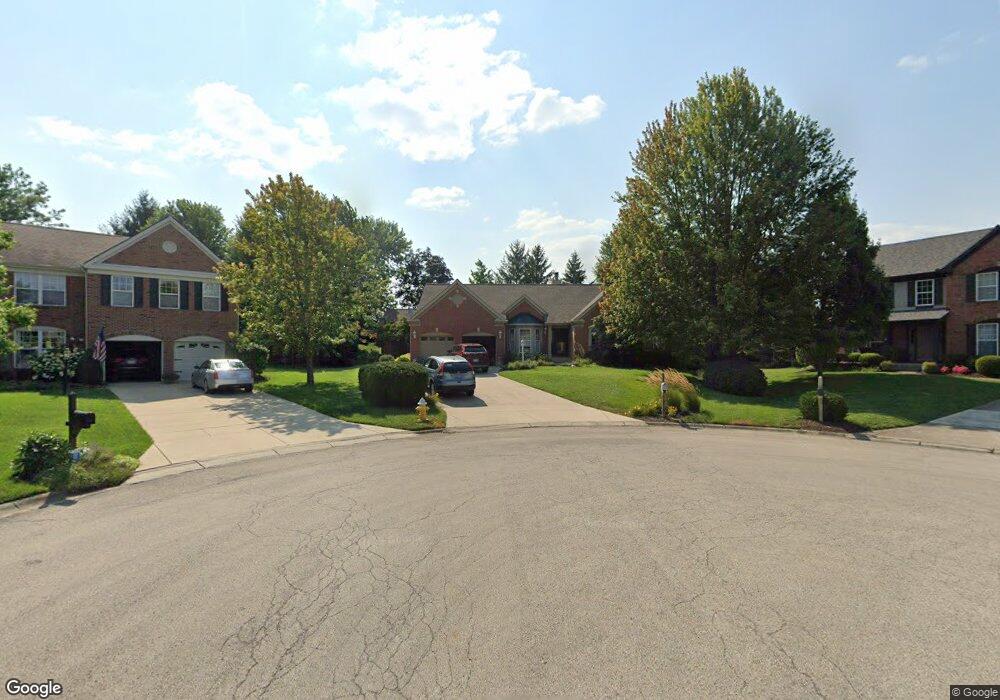
2812 Stratton Ct Dayton, OH 45458
Estimated Value: $466,000 - $606,000
5
Beds
4
Baths
4,800
Sq Ft
$113/Sq Ft
Est. Value
About This Home
This home is located at 2812 Stratton Ct, Dayton, OH 45458 and is currently estimated at $543,548, approximately $113 per square foot. 2812 Stratton Ct is a home located in Montgomery County with nearby schools including Primary Village South, Weller Elementary School, and Tower Heights Middle School.
Ownership History
Date
Name
Owned For
Owner Type
Purchase Details
Closed on
Aug 28, 2017
Sold by
Atkins Carol J Glaser and Glaser Marie J
Bought by
Singer Daniel M and Singer Joyce R
Current Estimated Value
Home Financials for this Owner
Home Financials are based on the most recent Mortgage that was taken out on this home.
Original Mortgage
$244,800
Outstanding Balance
$132,158
Interest Rate
3.93%
Mortgage Type
New Conventional
Estimated Equity
$411,390
Purchase Details
Closed on
May 13, 2005
Sold by
Ahmed Dawood and Ahmed Samia A
Bought by
Glaser Vernon M and Glaser Marjorie A
Purchase Details
Closed on
Jun 28, 2004
Sold by
Rasmussen Rodney R and Rasmussen Barbara C
Bought by
Ahmed Dawood and Ahmed Samia A
Home Financials for this Owner
Home Financials are based on the most recent Mortgage that was taken out on this home.
Original Mortgage
$236,000
Interest Rate
4.75%
Mortgage Type
Purchase Money Mortgage
Create a Home Valuation Report for This Property
The Home Valuation Report is an in-depth analysis detailing your home's value as well as a comparison with similar homes in the area
Home Values in the Area
Average Home Value in this Area
Purchase History
| Date | Buyer | Sale Price | Title Company |
|---|---|---|---|
| Singer Daniel M | $306,000 | M&M Title Co | |
| Glaser Vernon M | $305,000 | -- | |
| Ahmed Dawood | $295,000 | -- |
Source: Public Records
Mortgage History
| Date | Status | Borrower | Loan Amount |
|---|---|---|---|
| Open | Singer Daniel M | $244,800 | |
| Previous Owner | Ahmed Dawood | $236,000 |
Source: Public Records
Tax History Compared to Growth
Tax History
| Year | Tax Paid | Tax Assessment Tax Assessment Total Assessment is a certain percentage of the fair market value that is determined by local assessors to be the total taxable value of land and additions on the property. | Land | Improvement |
|---|---|---|---|---|
| 2024 | $10,258 | $166,640 | $24,680 | $141,960 |
| 2023 | $10,258 | $166,640 | $24,680 | $141,960 |
| 2022 | $9,186 | $118,060 | $17,500 | $100,560 |
| 2021 | $9,212 | $118,060 | $17,500 | $100,560 |
| 2020 | $9,199 | $118,060 | $17,500 | $100,560 |
| 2019 | $9,475 | $108,680 | $17,500 | $91,180 |
| 2018 | $8,461 | $108,680 | $17,500 | $91,180 |
| 2017 | $7,699 | $108,680 | $17,500 | $91,180 |
| 2016 | $7,404 | $99,330 | $17,500 | $81,830 |
| 2015 | $7,263 | $99,330 | $17,500 | $81,830 |
| 2014 | $7,263 | $99,330 | $17,500 | $81,830 |
| 2012 | -- | $88,660 | $23,100 | $65,560 |
Source: Public Records
Map
Nearby Homes
- 2211 E Social Row Rd
- 9266 Ridings Blvd
- 9850 Fairwater Springs Dr
- 2037 Stablehand Dr
- 0 Rooks Rd
- 3110 Beech Hill Dr
- 9882 Saddle Creek Trail
- 3076 Beech Hill Dr
- 1332 Clydesdale Ct
- 4103 Middle Run Rd
- 9354 Buckboard Dr
- 9101 Rooks Rd
- 10067 Yearling Run S
- 2780 E Spring Valley Pike
- 10059 Yearling Run S
- 1943 Horseshoe Bend
- 1890 Horseshoe Bend
- 1947 Horseshoe Bend
- 1886 Horseshoe Bend
- 9424 Clyo Rd
- 2821 Stratton Ct
- 2822 Stratton Ct
- 2831 Stratton Ct
- 2810 Chesney Ct
- 2832 Stratton Ct
- 2800 Chesney Ct
- 2820 Chesney Ct
- 2842 Stratton Ct
- 10286 Clyo Rd
- 10121 Tillman Rd
- 2830 Chesney Ct
- 2811 Chesney Ct
- 10111 Tillman Rd
- 2901 Dutton Ct
- 2821 Chesney Ct
- 10140 Tillman Rd
- 2831 Chesney Ct
- 10158 Tillman Rd
- 10176 Tillman Rd
- 2850 Black Horse Ct