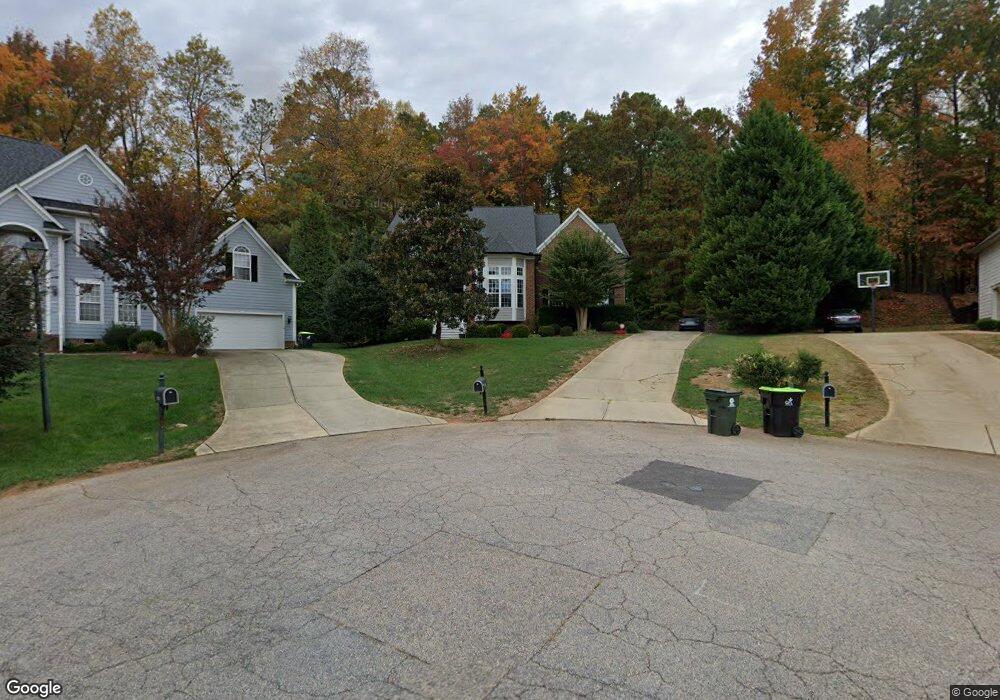
2816 Kissing Ct Raleigh, NC 27613
Falls Lake NeighborhoodEstimated Value: $797,989 - $882,000
4
Beds
3
Baths
3,200
Sq Ft
$261/Sq Ft
Est. Value
About This Home
This home is located at 2816 Kissing Ct, Raleigh, NC 27613 and is currently estimated at $835,497, approximately $261 per square foot. 2816 Kissing Ct is a home located in Wake County with nearby schools including Pine Hollow Middle School, Leesville Road High School, and The Franciscan School.
Ownership History
Date
Name
Owned For
Owner Type
Purchase Details
Closed on
Mar 1, 2004
Sold by
Cendant Mobility Financial Corp
Bought by
Hesla David G and Hesla Tracy G
Current Estimated Value
Home Financials for this Owner
Home Financials are based on the most recent Mortgage that was taken out on this home.
Original Mortgage
$235,000
Outstanding Balance
$110,213
Interest Rate
5.72%
Mortgage Type
Purchase Money Mortgage
Estimated Equity
$725,284
Purchase Details
Closed on
Jan 20, 2004
Sold by
Brown Donald and Brown Tanisha
Bought by
Cendant Mobility Financial Corp
Home Financials for this Owner
Home Financials are based on the most recent Mortgage that was taken out on this home.
Original Mortgage
$235,000
Outstanding Balance
$110,213
Interest Rate
5.72%
Mortgage Type
Purchase Money Mortgage
Estimated Equity
$725,284
Purchase Details
Closed on
Feb 13, 2002
Sold by
Weekley Homes Lp
Bought by
Brown Donald and Brown Tanisha
Home Financials for this Owner
Home Financials are based on the most recent Mortgage that was taken out on this home.
Original Mortgage
$300,700
Interest Rate
6.37%
Create a Home Valuation Report for This Property
The Home Valuation Report is an in-depth analysis detailing your home's value as well as a comparison with similar homes in the area
Home Values in the Area
Average Home Value in this Area
Purchase History
| Date | Buyer | Sale Price | Title Company |
|---|---|---|---|
| Hesla David G | $334,500 | -- | |
| Cendant Mobility Financial Corp | $334,500 | -- | |
| Brown Donald | $320,500 | -- |
Source: Public Records
Mortgage History
| Date | Status | Borrower | Loan Amount |
|---|---|---|---|
| Open | Hesla David G | $235,000 | |
| Previous Owner | Brown Donald | $300,700 | |
| Closed | Hesla David G | $32,500 |
Source: Public Records
Tax History Compared to Growth
Tax History
| Year | Tax Paid | Tax Assessment Tax Assessment Total Assessment is a certain percentage of the fair market value that is determined by local assessors to be the total taxable value of land and additions on the property. | Land | Improvement |
|---|---|---|---|---|
| 2025 | $4,643 | $722,853 | $120,000 | $602,853 |
| 2024 | $4,509 | $722,853 | $120,000 | $602,853 |
| 2023 | $3,658 | $466,601 | $100,000 | $366,601 |
| 2022 | $3,390 | $466,601 | $100,000 | $366,601 |
| 2021 | $3,299 | $466,601 | $100,000 | $366,601 |
| 2020 | $3,244 | $466,601 | $100,000 | $366,601 |
| 2019 | $3,232 | $393,276 | $110,000 | $283,276 |
| 2018 | $2,971 | $393,276 | $110,000 | $283,276 |
| 2017 | $2,816 | $393,276 | $110,000 | $283,276 |
| 2016 | $2,759 | $393,276 | $110,000 | $283,276 |
| 2015 | $3,168 | $453,215 | $106,000 | $347,215 |
| 2014 | $3,002 | $453,215 | $106,000 | $347,215 |
Source: Public Records
Map
Nearby Homes
- 5020 Red Cedar Rd
- 12316 Amoretto Way
- 5000 Morning Edge Dr
- 5028 Morning Edge Dr
- 5216 Sutter Way
- 5008 Dawn Piper Dr
- 5024 Dawn Piper Dr
- 12436 Harcourt Dr
- 12316 Inglehurst Dr
- 5906 Dunzo Dr
- 5900 Dunzo Dr
- 5952 Dunzo Dr
- 5902 Dunzo Dr
- 5956 Dunzo Dr
- 5904 Dunzo Dr
- 5404 Staysail Ct
- 11113 N Radner Way
- 6108 Dunzo Dr
- 5950 Dunzo Dr
- 5316 Easthorpe Dr
- 2812 Kissing Ct
- 2820 Kissing Ct
- 2808 Kissing Ct
- 2817 Kissing Ct
- 10008 Liana Ln
- 2813 Kissing Ct
- 2809 Kissing Ct
- 2805 Kissing Ct
- 5325 Indigo Moon Way
- 5329 Indigo Moon Way
- 5004 Martin Farm Rd
- 5321 Indigo Moon Way
- 5000 Martin Farm Rd
- 5317 Indigo Moon Way
- 5008 Martin Farm Rd
- 10012 Liana Ln
- 5333 Indigo Moon Way
- 5001 Martin Farm Rd
- 5313 Indigo Moon Way
- 5328 Indigo Moon Way