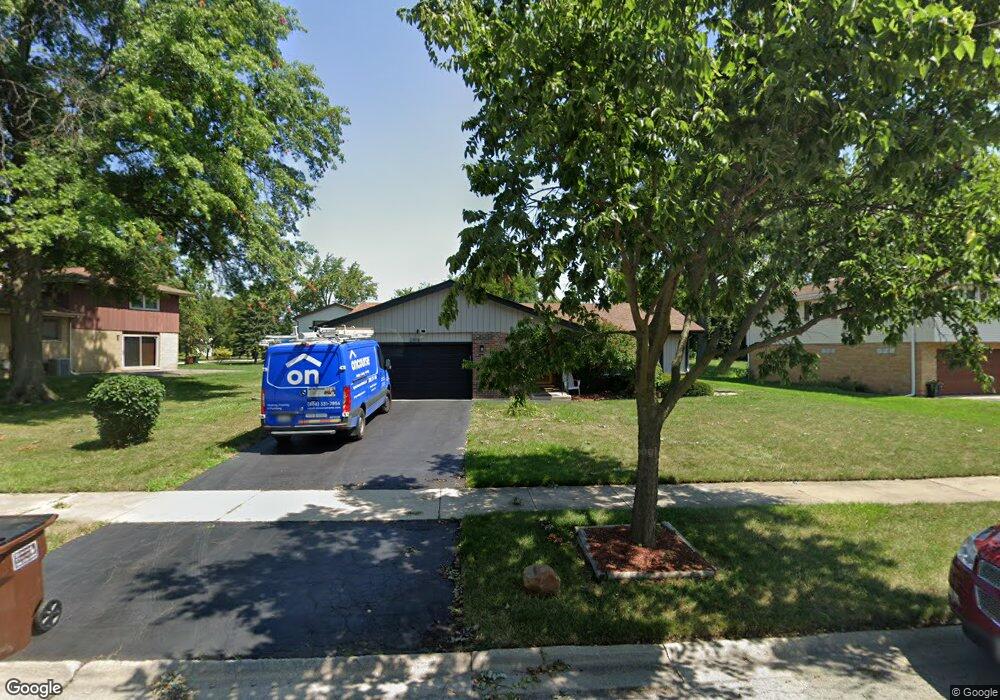
2818 Tarpon Ct Homewood, IL 60430
Estimated Value: $274,000 - $357,000
4
Beds
2
Baths
1,686
Sq Ft
$184/Sq Ft
Est. Value
About This Home
This home is located at 2818 Tarpon Ct, Homewood, IL 60430 and is currently estimated at $310,584, approximately $184 per square foot. 2818 Tarpon Ct is a home located in Cook County with nearby schools including Flossmoor Hills Elementary School, Parker Junior High School, and Homewood-Flossmoor High School.
Ownership History
Date
Name
Owned For
Owner Type
Purchase Details
Closed on
Jan 14, 2022
Sold by
Grant Michael A and Grant Y
Bought by
Grant Michael A and Sebastien Alice
Current Estimated Value
Home Financials for this Owner
Home Financials are based on the most recent Mortgage that was taken out on this home.
Original Mortgage
$247,500
Outstanding Balance
$228,428
Interest Rate
3.22%
Estimated Equity
$82,156
Purchase Details
Closed on
Aug 11, 2016
Sold by
Grant Michael A and Sebastien Alice
Bought by
Grant Michael A
Purchase Details
Closed on
Sep 14, 2012
Sold by
Grant Michael A
Bought by
Grant Michael A and Sebastien Alice
Purchase Details
Closed on
Jun 4, 1997
Sold by
Seifer Howard A and Seifer Frances
Bought by
Girard Gregory B and Girard Pamela M
Home Financials for this Owner
Home Financials are based on the most recent Mortgage that was taken out on this home.
Original Mortgage
$120,700
Interest Rate
8.01%
Create a Home Valuation Report for This Property
The Home Valuation Report is an in-depth analysis detailing your home's value as well as a comparison with similar homes in the area
Home Values in the Area
Average Home Value in this Area
Purchase History
| Date | Buyer | Sale Price | Title Company |
|---|---|---|---|
| Grant Michael A | -- | -- | |
| Grant Michael A | -- | -- | |
| Grant Michael A | -- | Attorney | |
| Grant Michael A | -- | None Available | |
| Girard Gregory B | $142,000 | -- |
Source: Public Records
Mortgage History
| Date | Status | Borrower | Loan Amount |
|---|---|---|---|
| Open | Grant Michael A | $247,500 | |
| Previous Owner | Girard Gregory B | $120,700 |
Source: Public Records
Tax History Compared to Growth
Tax History
| Year | Tax Paid | Tax Assessment Tax Assessment Total Assessment is a certain percentage of the fair market value that is determined by local assessors to be the total taxable value of land and additions on the property. | Land | Improvement |
|---|---|---|---|---|
| 2024 | $7,442 | $23,000 | $5,756 | $17,244 |
| 2023 | $6,417 | $23,000 | $5,756 | $17,244 |
| 2022 | $6,417 | $16,702 | $4,934 | $11,768 |
| 2021 | $6,452 | $16,701 | $4,933 | $11,768 |
| 2020 | $6,296 | $16,701 | $4,933 | $11,768 |
| 2019 | $5,864 | $15,517 | $4,385 | $11,132 |
| 2018 | $5,707 | $15,517 | $4,385 | $11,132 |
| 2017 | $6,118 | $16,558 | $4,385 | $12,173 |
| 2016 | $4,540 | $11,953 | $3,837 | $8,116 |
| 2015 | $5,334 | $13,700 | $3,837 | $9,863 |
| 2014 | $5,754 | $14,778 | $3,837 | $10,941 |
| 2013 | $5,760 | $13,363 | $3,837 | $9,526 |
Source: Public Records
Map
Nearby Homes
- 18320 Cherry Creek Dr Unit 3
- 18340 Cherry Creek Dr Unit 7
- 18024 Marlin Ln
- 18400 Cherry Creek Dr Unit 105
- 18327 Argyle Ave
- 2533 Hickory Rd
- 2807 Willow Rd Unit 103
- 18210 Perth Ave
- 3048 Matthew Ln Unit B3
- 18509 Stedhall Rd
- 18530 Stedhall Rd
- 18107 Kedzie Ave
- 3111 Smoke Tree Ct
- 17805 Dogwood Ln
- 2908 Buttonwood Walk
- 17804 Pebblewood Ln
- 18314 Dundee Ave
- 17803 Dogwood Ln
- 18445 Kedzie Ave
- 2619 Alexander St
- 2812 Tarpon Ct
- 18151 Los Angeles Ave
- 18137 Los Angeles s Ct
- 18137 Los Angeles Ct S
- 18145 Los Angeles Ave
- 2806 Tarpon Ct
- 18200 California Ave
- 2800 Tarpon Ct
- 18131 Los Angeles s Ct
- 18150 Los Angeles Ave
- 18210 California Ave
- 18142 Los Angeles Ave
- 18205 California Ave
- 18119 Los Angeles Ave
- 18125 Los Angeles s Ct
- 18152 Cherrywood Ln
- 18134 Los Angeles Ave
- 18160 Cherrywood Ln
- 18146 Cherrywood Ln