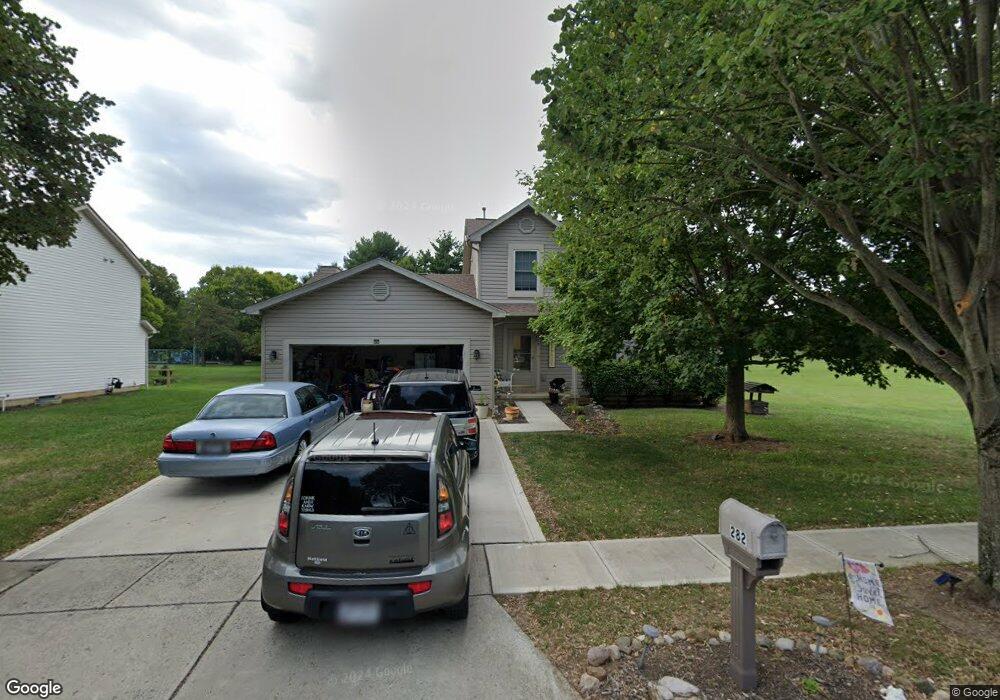
282 Green Ave Groveport, OH 43125
Estimated Value: $261,000 - $329,000
3
Beds
3
Baths
1,602
Sq Ft
$188/Sq Ft
Est. Value
About This Home
This home is located at 282 Green Ave, Groveport, OH 43125 and is currently estimated at $300,530, approximately $187 per square foot. 282 Green Ave is a home located in Franklin County with nearby schools including Groveport Madison High School, Groveport Community School, and Madison Christian School.
Ownership History
Date
Name
Owned For
Owner Type
Purchase Details
Closed on
Aug 31, 2013
Sold by
Irrevoca Trentanelli Dhir Angela and Irrevoca Barbara K Trentanelli
Bought by
Westcamp Lance M and Westcamp Julie A
Current Estimated Value
Home Financials for this Owner
Home Financials are based on the most recent Mortgage that was taken out on this home.
Original Mortgage
$98,188
Outstanding Balance
$73,560
Interest Rate
4.5%
Mortgage Type
FHA
Estimated Equity
$226,970
Purchase Details
Closed on
Apr 6, 2012
Sold by
Trentanelli Barbara and Trentanelli Barbara K
Bought by
Trantanelli Barbara K and Trentanellie Irrevao Barbara K
Purchase Details
Closed on
May 12, 2011
Sold by
Fannie Mae
Bought by
Trentanelli Barbara
Purchase Details
Closed on
Jun 23, 2010
Sold by
Layman Mickey and Layman Cathi A
Bought by
Federal National Mortgage Association
Purchase Details
Closed on
Oct 15, 2001
Sold by
Green Bros Painting Inc
Bought by
Layman Mick and Layman Cathi A
Create a Home Valuation Report for This Property
The Home Valuation Report is an in-depth analysis detailing your home's value as well as a comparison with similar homes in the area
Home Values in the Area
Average Home Value in this Area
Purchase History
| Date | Buyer | Sale Price | Title Company |
|---|---|---|---|
| Westcamp Lance M | $100,000 | Transcounty Title Agency | |
| Trantanelli Barbara K | -- | None Available | |
| Trentanelli Barbara | $100,000 | Accutitle Agency Inc | |
| Federal National Mortgage Association | $92,000 | None Available | |
| Layman Mick | $8,500 | -- | |
| Layman Mick | $8,500 | -- |
Source: Public Records
Mortgage History
| Date | Status | Borrower | Loan Amount |
|---|---|---|---|
| Open | Westcamp Lance M | $98,188 |
Source: Public Records
Tax History Compared to Growth
Tax History
| Year | Tax Paid | Tax Assessment Tax Assessment Total Assessment is a certain percentage of the fair market value that is determined by local assessors to be the total taxable value of land and additions on the property. | Land | Improvement |
|---|---|---|---|---|
| 2024 | $4,695 | $96,010 | $26,570 | $69,440 |
| 2023 | $4,654 | $96,005 | $26,565 | $69,440 |
| 2022 | $3,886 | $63,950 | $8,400 | $55,550 |
| 2021 | $3,900 | $63,950 | $8,400 | $55,550 |
| 2020 | $3,909 | $63,950 | $8,400 | $55,550 |
| 2019 | $3,699 | $53,340 | $7,000 | $46,340 |
| 2018 | $3,735 | $53,340 | $7,000 | $46,340 |
| 2017 | $3,728 | $53,340 | $7,000 | $46,340 |
| 2016 | $3,717 | $48,300 | $10,360 | $37,940 |
| 2015 | $3,750 | $48,300 | $10,360 | $37,940 |
| 2014 | $3,530 | $48,300 | $10,360 | $37,940 |
| 2013 | $1,585 | $50,855 | $10,920 | $39,935 |
Source: Public Records
Map
Nearby Homes