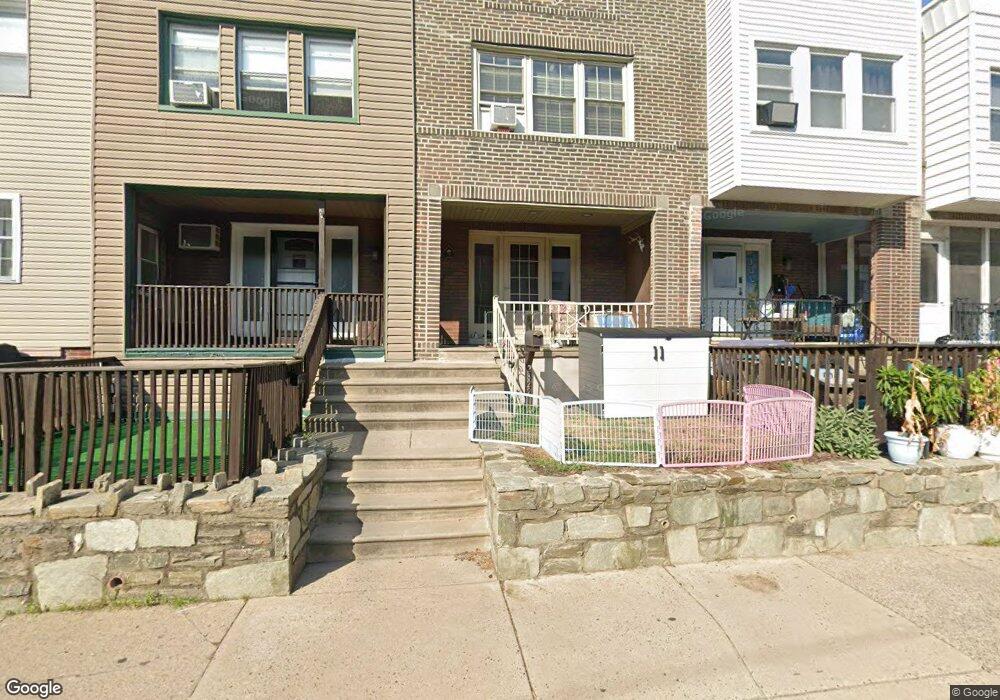
2820 Gillingham St Philadelphia, PA 19137
Bridesburg NeighborhoodEstimated Value: $175,000 - $236,000
2
Beds
1
Bath
1,065
Sq Ft
$205/Sq Ft
Est. Value
About This Home
This home is located at 2820 Gillingham St, Philadelphia, PA 19137 and is currently estimated at $218,349, approximately $205 per square foot. 2820 Gillingham St is a home located in Philadelphia County with nearby schools including Bridesburg School, Frankford High School, and Franklin Towne Charter Elementary School.
Ownership History
Date
Name
Owned For
Owner Type
Purchase Details
Closed on
Mar 11, 2016
Sold by
Oneill Albert J and Oneill Albert John
Bought by
Oneill Albert John
Current Estimated Value
Home Financials for this Owner
Home Financials are based on the most recent Mortgage that was taken out on this home.
Original Mortgage
$119,790
Outstanding Balance
$96,774
Interest Rate
4.37%
Mortgage Type
FHA
Estimated Equity
$121,575
Purchase Details
Closed on
Jul 30, 2012
Sold by
Finnerty Heather and Estate Of Thomas Finnerty
Bought by
Oneill Albert J
Home Financials for this Owner
Home Financials are based on the most recent Mortgage that was taken out on this home.
Original Mortgage
$76,587
Interest Rate
3.42%
Mortgage Type
FHA
Purchase Details
Closed on
Jul 14, 1995
Sold by
Morell Daniel K
Bought by
Finnerty Thomas P and Finnerty Sandra L
Purchase Details
Closed on
May 4, 1993
Sold by
Morell Daniel K and Morell Dawn M
Bought by
Morell Daniel K
Create a Home Valuation Report for This Property
The Home Valuation Report is an in-depth analysis detailing your home's value as well as a comparison with similar homes in the area
Home Values in the Area
Average Home Value in this Area
Purchase History
| Date | Buyer | Sale Price | Title Company |
|---|---|---|---|
| Oneill Albert John | $122,000 | None Available | |
| Oneill Albert J | $78,000 | None Available | |
| Finnerty Thomas P | $57,900 | -- | |
| Morell Daniel K | -- | -- |
Source: Public Records
Mortgage History
| Date | Status | Borrower | Loan Amount |
|---|---|---|---|
| Open | Oneill Albert John | $119,790 | |
| Previous Owner | Oneill Albert J | $76,587 |
Source: Public Records
Tax History Compared to Growth
Tax History
| Year | Tax Paid | Tax Assessment Tax Assessment Total Assessment is a certain percentage of the fair market value that is determined by local assessors to be the total taxable value of land and additions on the property. | Land | Improvement |
|---|---|---|---|---|
| 2026 | $2,378 | $194,700 | $38,940 | $155,760 |
| 2025 | $2,378 | $194,700 | $38,940 | $155,760 |
| 2024 | $2,378 | $194,700 | $38,940 | $155,760 |
| 2023 | $2,378 | $169,900 | $33,980 | $135,920 |
| 2022 | $1,989 | $169,900 | $33,980 | $135,920 |
| 2021 | $1,989 | $0 | $0 | $0 |
| 2020 | $1,989 | $0 | $0 | $0 |
| 2019 | $1,846 | $0 | $0 | $0 |
| 2018 | $1,663 | $0 | $0 | $0 |
| 2017 | $1,663 | $0 | $0 | $0 |
| 2016 | $1,663 | $0 | $0 | $0 |
| 2015 | $1,592 | $0 | $0 | $0 |
| 2014 | -- | $118,800 | $18,735 | $100,065 |
| 2012 | -- | $12,544 | $1,945 | $10,599 |
Source: Public Records
Map
Nearby Homes
- 2737 Plum St
- 4418 Salmon St
- 4449 Garden St
- 2757 Croydon St
- 2650 Orthodox St
- 2710 Eddington St
- 4493 Edgemont St
- 2877-79 Hedley St
- 2578 Orthodox St
- 2746 Buckius St
- 4474 Livingston St
- 4618 Emery St
- 4631-33 Salmon St
- 4627 Edgemont St
- 4524 Miller St
- 4523 Gaul St
- 2752-54 Kirkbride St
- 2718 Pratt St
- 2740 Pratt St
- 2744 Pratt St
- 2822 Gillingham St
- 2818 Gillingham St
- 2824 Gillingham St
- 2816 Gillingham St
- 2826 Gillingham St
- 2828 Gillingham St
- 2830 Gillingham St
- 2819 Sellers St
- 2817 Sellers St
- 2821 Sellers St
- 2815 Sellers St
- 2832 Gillingham St
- 2823 Sellers St
- 2825 Sellers St
- 2827 Sellers St
- 2834 Gillingham St
- 2829 Sellers St
- 2819 Gillingham St
- 2836 Gillingham St
- 2831 Sellers St