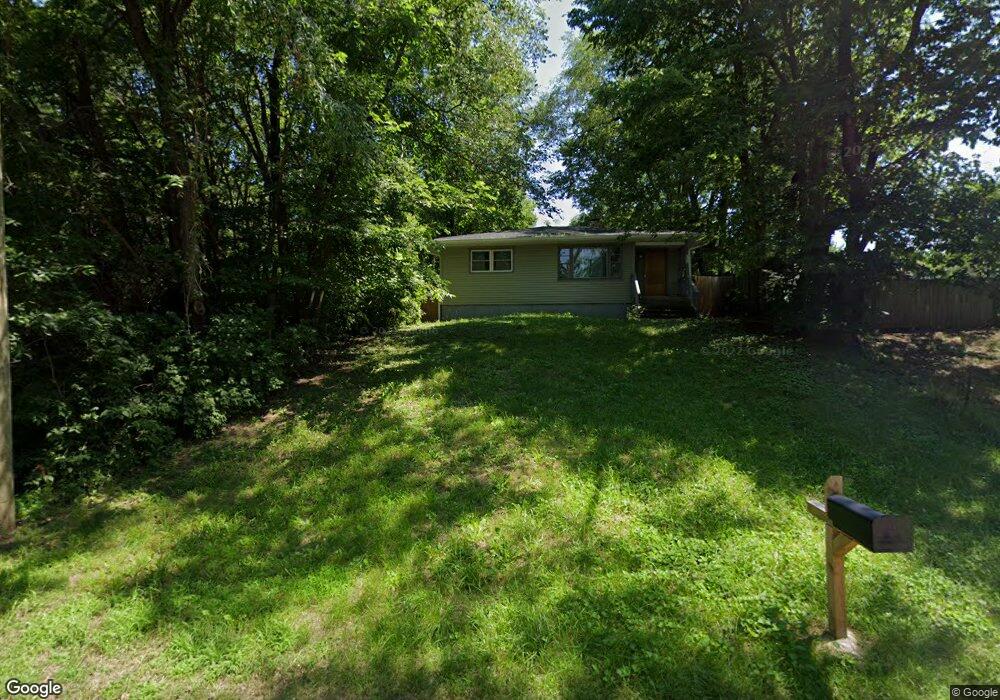
2820 Olsen St Rockford, IL 61109
Estimated Value: $86,693 - $96,000
2
Beds
1
Bath
965
Sq Ft
$94/Sq Ft
Est. Value
About This Home
This home is located at 2820 Olsen St, Rockford, IL 61109 and is currently estimated at $90,923, approximately $94 per square foot. 2820 Olsen St is a home located in Winnebago County with nearby schools including Riverdahl Elementary School, Rockford Environmental Science Academy, and Jefferson High School.
Ownership History
Date
Name
Owned For
Owner Type
Purchase Details
Closed on
Dec 11, 2018
Sold by
Jpmorgan Chase Bk Natl Assn
Bought by
Tonys Management Co Inc
Current Estimated Value
Purchase Details
Closed on
Feb 20, 2018
Sold by
Judicial Sales Corporation
Bought by
Jpmorgan Chase Bank National A
Purchase Details
Closed on
Jan 29, 2018
Sold by
Judicial Sales Corporation
Bought by
Jpmorgan Chase Bank National A
Purchase Details
Closed on
Feb 14, 2001
Bought by
Jeffery Elizabeth
Create a Home Valuation Report for This Property
The Home Valuation Report is an in-depth analysis detailing your home's value as well as a comparison with similar homes in the area
Home Values in the Area
Average Home Value in this Area
Purchase History
| Date | Buyer | Sale Price | Title Company |
|---|---|---|---|
| Tonys Management Co Inc | $6,842 | Metropolitan Title Agency Inc | |
| Tonys Management Company Inc | $7,000 | Ginali Associates Pc | |
| Jpmorgan Chase Bank National A | -- | Heavner Beyers & Mihlar Llc | |
| Jpmorgan Chase Bank National A | -- | Heavner Beyers & Mihlar Llc | |
| Jeffery Elizabeth | $36,700 | -- |
Source: Public Records
Tax History Compared to Growth
Tax History
| Year | Tax Paid | Tax Assessment Tax Assessment Total Assessment is a certain percentage of the fair market value that is determined by local assessors to be the total taxable value of land and additions on the property. | Land | Improvement |
|---|---|---|---|---|
| 2024 | $1,342 | $14,160 | $563 | $13,597 |
| 2023 | $911 | $8,772 | $497 | $8,275 |
| 2022 | $896 | $7,840 | $444 | $7,396 |
| 2021 | $881 | $7,189 | $407 | $6,782 |
| 2020 | $774 | $6,796 | $385 | $6,411 |
| 2019 | $806 | $6,477 | $367 | $6,110 |
| 2018 | $890 | $6,469 | $346 | $6,123 |
| 2017 | $893 | $10,667 | $330 | $10,337 |
| 2016 | $909 | $10,467 | $324 | $10,143 |
| 2015 | $921 | $10,467 | $324 | $10,143 |
| 2014 | $843 | $11,055 | $406 | $10,649 |
Source: Public Records
Map
Nearby Homes