Estimated Value: $591,000 - $618,000
4
Beds
3
Baths
3,248
Sq Ft
$187/Sq Ft
Est. Value
About This Home
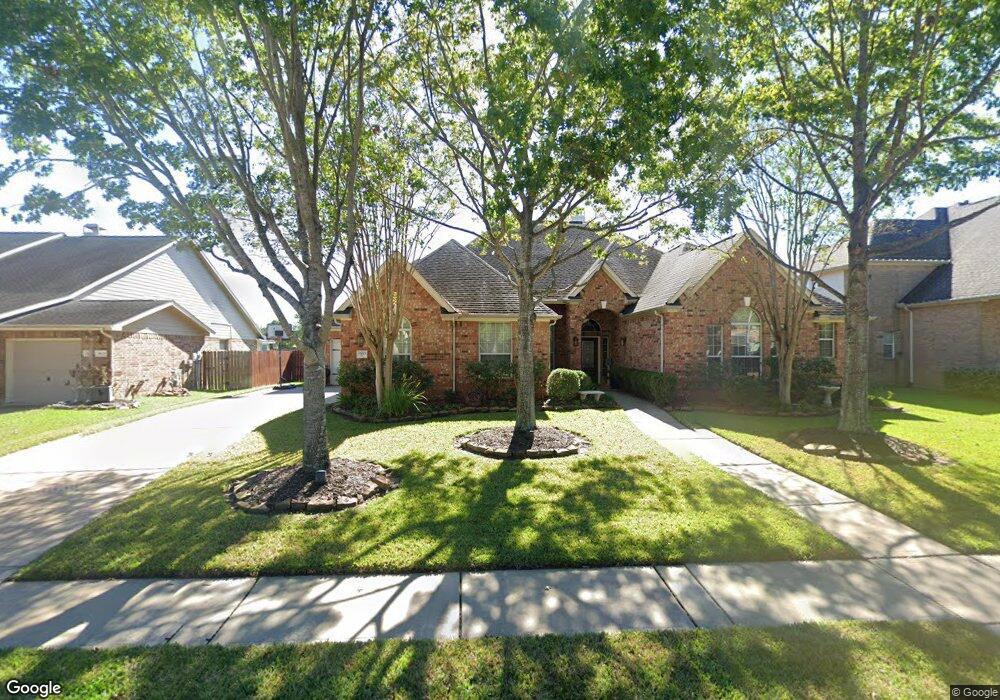
This home is located at 28203 Gadwall Dr, Katy, TX 77494 and is currently estimated at $608,317, approximately $187 per square foot. 28203 Gadwall Dr is a home located in Fort Bend County with nearby schools including Ray And Jamie Wolman Elementary School, Woodcreek Junior High School, and Katy High School.
Ownership History
Date
Name
Owned For
Owner Type
Purchase Details
Closed on
Jul 31, 2015
Sold by
Cotton Jack G and Cotton Vickie J
Bought by
Mitchell Robert L and Mitchell Crystal N
Current Estimated Value
Home Financials for this Owner
Home Financials are based on the most recent Mortgage that was taken out on this home.
Original Mortgage
$370,500
Outstanding Balance
$290,201
Interest Rate
4.07%
Estimated Equity
$318,116
Purchase Details
Closed on
Jun 13, 2006
Sold by
Mhi Partnership Ltd
Bought by
Cotton Jack G and Cotton Vickie J
Home Financials for this Owner
Home Financials are based on the most recent Mortgage that was taken out on this home.
Original Mortgage
$229,290
Interest Rate
6.58%
Mortgage Type
Purchase Money Mortgage
Purchase Details
Closed on
Dec 15, 2005
Sold by
Jdc / Firethorne Ltd
Bought by
Mitchell Robert L and Mitchell Crystal N
Create a Home Valuation Report for This Property
The Home Valuation Report is an in-depth analysis detailing your home's value as well as a comparison with similar homes in the area
Home Values in the Area
Average Home Value in this Area
Purchase History
| Date | Buyer | Sale Price | Title Company |
|---|---|---|---|
| Mitchell Robert L | -- | None Available | |
| Cotton Jack G | -- | Millennium Title Houston | |
| Mitchell Robert L | -- | -- | |
| Mitchell Robert L | -- | -- |
Source: Public Records
Mortgage History
| Date | Status | Borrower | Loan Amount |
|---|---|---|---|
| Open | Mitchell Robert L | $370,500 | |
| Previous Owner | Mitchell Robert L | $229,290 |
Source: Public Records
Tax History Compared to Growth
Tax History
| Year | Tax Paid | Tax Assessment Tax Assessment Total Assessment is a certain percentage of the fair market value that is determined by local assessors to be the total taxable value of land and additions on the property. | Land | Improvement |
|---|---|---|---|---|
| 2025 | $10,542 | $573,914 | $117,260 | $464,165 |
| 2024 | $10,542 | $521,740 | $11,281 | $510,459 |
| 2023 | $9,745 | $474,309 | $0 | $516,896 |
| 2022 | $10,326 | $431,190 | $0 | $452,060 |
| 2021 | $10,562 | $391,990 | $90,200 | $301,790 |
| 2020 | $10,126 | $370,630 | $70,000 | $300,630 |
| 2019 | $10,357 | $353,400 | $70,000 | $283,400 |
| 2018 | $10,847 | $366,990 | $70,000 | $296,990 |
| 2017 | $10,603 | $354,560 | $70,000 | $284,560 |
| 2016 | $11,563 | $386,630 | $70,000 | $316,630 |
| 2015 | $6,283 | $349,670 | $70,000 | $279,670 |
| 2014 | $5,882 | $317,880 | $70,000 | $247,880 |
Source: Public Records
Map
Nearby Homes
- 28219 Longspur Dr
- 2302 Osprey Park Dr
- 28011 Buckthorn Dr
- 2526 Llano Springs Dr
- 28119 Rusty Hawthorne Dr
- 2531 Llano Springs Dr
- 28006 Everett Knolls Dr
- 2218 Monarch Terrace Dr
- 2406 Brandyshire Dr
- 28523 Chesley Park Dr
- 28211 Crossprairie Dr
- 28514 Hayden Park Dr
- 28226 S Firethorne Rd
- 28230 Daystrom Ln
- 28514 Blue Holly Ln
- 2506 Foxcrest Dr
- 2802 Helding Park Ct
- 2835 Chalet Knolls Ln
- 2827 Fair Chase Dr
- 28514 Rock Wren Ct
- 28123 Gadwall Dr
- 28207 Gadwall Dr
- 28119 Gadwall Dr
- 28211 Gadwall Dr
- 28202 Gadwall Dr
- 28122 Gadwall Dr
- 28206 Gadwall Dr
- 28115 Gadwall Dr
- 28215 Gadwall Dr
- 28118 Gadwall Dr
- 28210 Gadwall Dr
- 28114 Gadwall Dr
- 28111 Gadwall Dr
- 28219 Gadwall Dr
- 28214 Gadwall Dr
- 28203 Longspur Dr
- 28127 Longspur Dr
- 28207 Longspur Dr
- 28123 Longspur Dr
- 28211 Longspur Dr