Estimated Value: $369,000 - $389,000
3
Beds
3
Baths
2,161
Sq Ft
$173/Sq Ft
Est. Value
About This Home
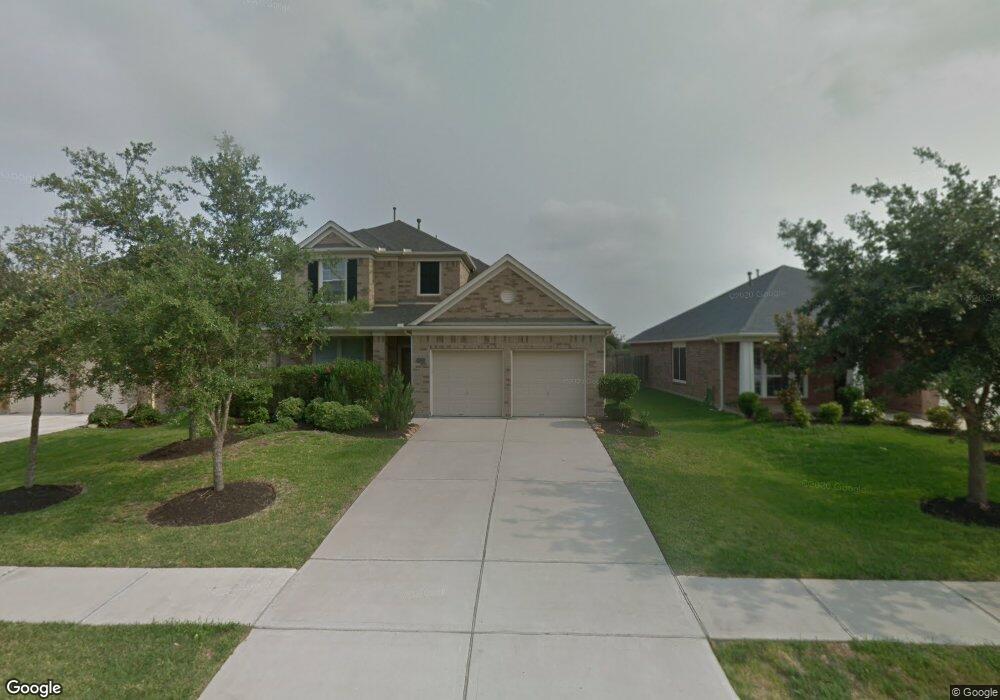
This home is located at 28218 Crossprairie Dr, Katy, TX 77494 and is currently estimated at $374,815, approximately $173 per square foot. 28218 Crossprairie Dr is a home located in Fort Bend County with nearby schools including Ray And Jamie Wolman Elementary School, Woodcreek Junior High School, and Katy High School.
Ownership History
Date
Name
Owned For
Owner Type
Purchase Details
Closed on
Dec 21, 2016
Sold by
Llauger Octavio S and Llauger Maria P
Bought by
Holder Brianne
Current Estimated Value
Home Financials for this Owner
Home Financials are based on the most recent Mortgage that was taken out on this home.
Original Mortgage
$172,800
Outstanding Balance
$139,748
Interest Rate
3.57%
Mortgage Type
New Conventional
Estimated Equity
$235,067
Purchase Details
Closed on
Oct 12, 2006
Sold by
Perry Homes
Bought by
Llauger Octavio S and Fregoso Maria P
Home Financials for this Owner
Home Financials are based on the most recent Mortgage that was taken out on this home.
Original Mortgage
$33,065
Interest Rate
6.41%
Mortgage Type
Stand Alone Second
Purchase Details
Closed on
Dec 23, 2005
Sold by
Jdc / Firethorne Ltd
Bought by
Holder Brianne
Create a Home Valuation Report for This Property
The Home Valuation Report is an in-depth analysis detailing your home's value as well as a comparison with similar homes in the area
Home Values in the Area
Average Home Value in this Area
Purchase History
| Date | Buyer | Sale Price | Title Company |
|---|---|---|---|
| Holder Brianne | -- | None Available | |
| Llauger Octavio S | -- | Chicago Title | |
| Holder Brianne | -- | -- | |
| Holder Brianne | -- | -- |
Source: Public Records
Mortgage History
| Date | Status | Borrower | Loan Amount |
|---|---|---|---|
| Open | Holder Brianne | $172,800 | |
| Previous Owner | Holder Brianne | $33,065 | |
| Previous Owner | Holder Brianne | $132,262 |
Source: Public Records
Tax History Compared to Growth
Tax History
| Year | Tax Paid | Tax Assessment Tax Assessment Total Assessment is a certain percentage of the fair market value that is determined by local assessors to be the total taxable value of land and additions on the property. | Land | Improvement |
|---|---|---|---|---|
| 2025 | $6,007 | $346,301 | $66,066 | $280,235 |
| 2024 | $6,007 | $318,787 | $33,306 | $285,481 |
| 2023 | $5,519 | $289,806 | $1,331 | $288,475 |
| 2022 | $6,106 | $263,460 | $3,550 | $259,910 |
| 2021 | $6,454 | $239,510 | $46,200 | $193,310 |
| 2020 | $6,207 | $227,180 | $42,000 | $185,180 |
| 2019 | $6,520 | $222,470 | $40,000 | $182,470 |
| 2018 | $6,589 | $222,930 | $40,000 | $182,930 |
| 2017 | $6,413 | $214,430 | $40,000 | $174,430 |
| 2016 | $6,751 | $225,730 | $40,000 | $185,730 |
| 2015 | $4,384 | $218,930 | $40,000 | $178,930 |
| 2014 | $3,939 | $194,890 | $40,000 | $154,890 |
Source: Public Records
Map
Nearby Homes
- 28211 Crossprairie Dr
- 28119 Rusty Hawthorne Dr
- 2531 Llano Springs Dr
- 28226 S Firethorne Rd
- 28230 Daystrom Ln
- 2526 Llano Springs Dr
- 2802 Helding Park Ct
- 28006 Everett Knolls Dr
- 2835 Chalet Knolls Ln
- 2827 Fair Chase Dr
- 28210 Chalet Park Dr
- 2406 Brandyshire Dr
- 28514 Blue Holly Ln
- 28219 Longspur Dr
- 28514 Hayden Park Dr
- 28523 Chesley Park Dr
- 2302 Osprey Park Dr
- 28514 Rock Wren Ct
- 2943 Fair Chase Dr
- 28011 Buckthorn Dr
- 28214 Crossprairie Dr
- 28222 Crossprairie Dr
- 2611 Pepperidge Dr
- 2610 Firecrest Dr
- 2607 Pepperidge Dr
- 2614 Firecrest Dr
- 2606 Firecrest Dr
- 28219 Crossprairie Dr
- 28234 Crossprairie Dr
- 28215 Crossprairie Dr
- 28223 Crossprairie Dr
- 2603 Pepperidge Dr
- 28227 Crossprairie Dr
- 28230 Fantail Dr
- 28231 Crossprairie Dr
- 28207 Crossprairie Dr
- 28203 Fantail Dr
- 28238 Crossprairie Dr
- 2551 Pepperidge Dr
- 28235 Crossprairie Dr