Estimated Value: $371,977 - $411,000
3
Beds
2
Baths
2,372
Sq Ft
$166/Sq Ft
Est. Value
About This Home
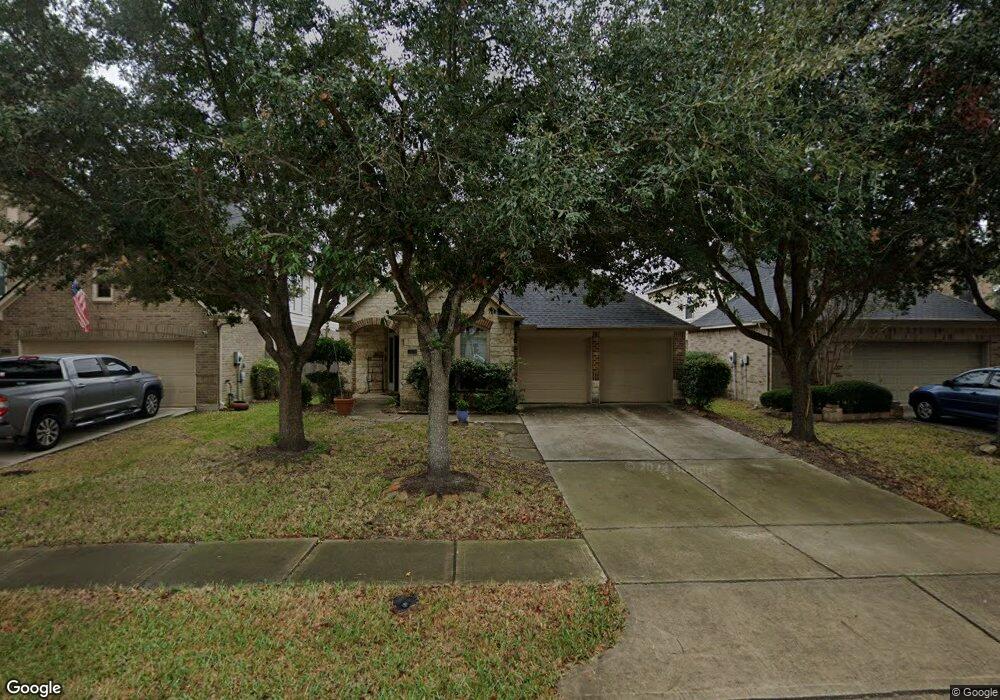
This home is located at 28231 Sweet Oak Ln, Katy, TX 77494 and is currently estimated at $394,744, approximately $166 per square foot. 28231 Sweet Oak Ln is a home located in Fort Bend County with nearby schools including Ray And Jamie Wolman Elementary School, Woodcreek Junior High School, and Katy High School.
Ownership History
Date
Name
Owned For
Owner Type
Purchase Details
Closed on
Dec 21, 2010
Sold by
Syphertt Luther C and Syphrett Janet L
Bought by
Cao Aimin and Zhao Yan
Current Estimated Value
Home Financials for this Owner
Home Financials are based on the most recent Mortgage that was taken out on this home.
Original Mortgage
$148,000
Outstanding Balance
$3,352
Interest Rate
4.41%
Mortgage Type
New Conventional
Estimated Equity
$391,392
Purchase Details
Closed on
Aug 11, 2008
Sold by
Perry Homes Llc
Bought by
Syphrett Luther C and Syphrett Janet L
Home Financials for this Owner
Home Financials are based on the most recent Mortgage that was taken out on this home.
Original Mortgage
$130,000
Interest Rate
6.38%
Mortgage Type
Purchase Money Mortgage
Purchase Details
Closed on
Dec 27, 2007
Sold by
Jdc / Firethorne Ltd
Bought by
Cao Aimin and Yan Zhao
Create a Home Valuation Report for This Property
The Home Valuation Report is an in-depth analysis detailing your home's value as well as a comparison with similar homes in the area
Home Values in the Area
Average Home Value in this Area
Purchase History
| Date | Buyer | Sale Price | Title Company |
|---|---|---|---|
| Cao Aimin | -- | Frontier Title Co Wh L L C | |
| Syphrett Luther C | -- | Chicago Title | |
| Cao Aimin | -- | -- | |
| Cao Aimin | -- | -- |
Source: Public Records
Mortgage History
| Date | Status | Borrower | Loan Amount |
|---|---|---|---|
| Open | Cao Aimin | $148,000 | |
| Previous Owner | Cao Aimin | $130,000 |
Source: Public Records
Tax History Compared to Growth
Tax History
| Year | Tax Paid | Tax Assessment Tax Assessment Total Assessment is a certain percentage of the fair market value that is determined by local assessors to be the total taxable value of land and additions on the property. | Land | Improvement |
|---|---|---|---|---|
| 2025 | $4,535 | $371,696 | $66,066 | $312,615 |
| 2024 | $4,535 | $337,905 | $26,079 | $311,826 |
| 2023 | $4,336 | $307,186 | $0 | $322,540 |
| 2022 | $5,548 | $279,260 | $0 | $286,720 |
| 2021 | $6,841 | $253,870 | $46,200 | $207,670 |
| 2020 | $6,712 | $245,690 | $42,000 | $203,690 |
| 2019 | $7,142 | $243,710 | $40,000 | $203,710 |
| 2018 | $7,192 | $243,350 | $40,000 | $203,350 |
| 2017 | $7,008 | $234,330 | $40,000 | $194,330 |
| 2016 | $7,493 | $250,540 | $40,000 | $210,540 |
| 2015 | $4,087 | $234,390 | $40,000 | $194,390 |
| 2014 | $3,867 | $213,080 | $40,000 | $173,080 |
Source: Public Records
Map
Nearby Homes
- 2802 Helding Park Ct
- 2827 Fair Chase Dr
- 28230 Daystrom Ln
- 28226 S Firethorne Rd
- 28210 Chalet Park Dr
- 2943 Fair Chase Dr
- 28211 Crossprairie Dr
- 28302 Hazel Trail
- 28407 Kinglet Pines Dr
- 2531 Llano Springs Dr
- 28514 Rock Wren Ct
- 2526 Llano Springs Dr
- 28119 Rusty Hawthorne Dr
- 28434 Eli Eagle St
- 2714 Ember Pass Ln
- 28514 Blue Holly Ln
- 28514 Eli Eagle St
- 28511 Eli Eagle St
- 2914 Legend Hill Dr
- 2710 Indigo Manor Ln
- 28227 Sweet Oak Ln
- 28235 Sweet Oak Ln
- 28223 Sweet Oak Ln
- 2811 Chalet Knolls Ln
- 2803 Helding Park Ct
- 28219 Sweet Oak Ln
- 2806 Helding Park Ct
- 28230 Sweet Oak Ln
- 28226 Sweet Oak Ln
- 28234 Sweet Oak Ln
- 28215 Sweet Oak Ln
- 28222 Sweet Oak Ln
- 2815 Chalet Knolls Ln
- 28238 Sweet Oak Ln
- 2819 Chalet Knolls Ln
- 2807 Helding Park Ct
- 2823 Chalet Knolls Ln
- 28218 Sweet Oak Ln
- 28242 Sweet Oak Ln
- 2810 Helding Park Ct