Estimated Value: $399,590 - $452,000
4
Beds
2
Baths
2,626
Sq Ft
$159/Sq Ft
Est. Value
About This Home
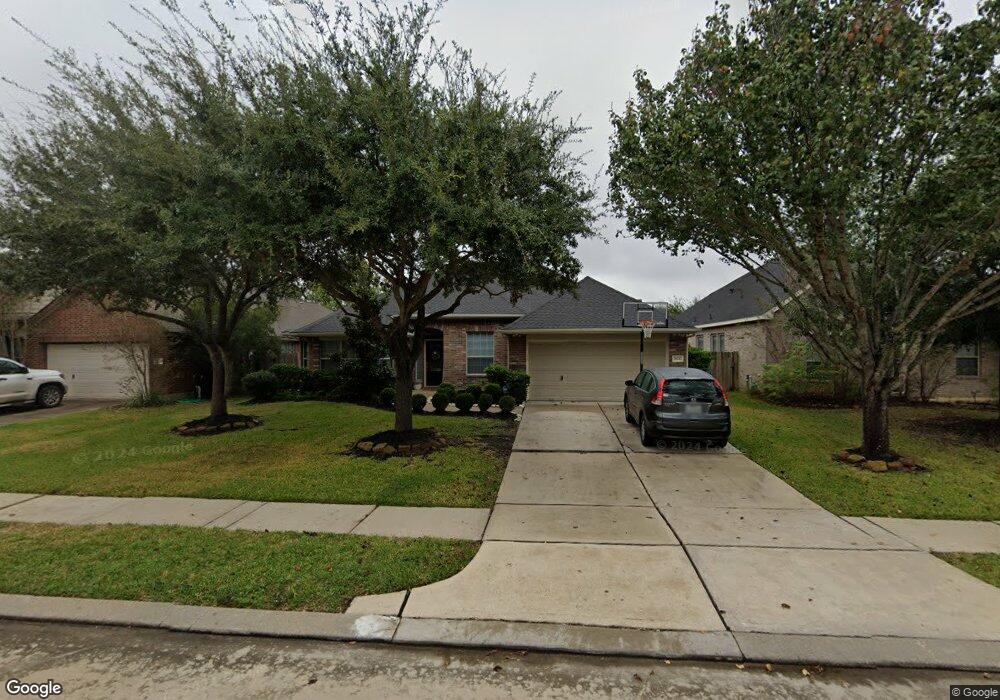
This home is located at 28242 Daystrom Ln, Katy, TX 77494 and is currently estimated at $416,648, approximately $158 per square foot. 28242 Daystrom Ln is a home located in Fort Bend County with nearby schools including Ray And Jamie Wolman Elementary School, Woodcreek Junior High School, and Katy High School.
Ownership History
Date
Name
Owned For
Owner Type
Purchase Details
Closed on
Jan 18, 2013
Sold by
Hargrave Ronald Eugene and Hargrave Cecile A
Bought by
Khadam Hir Steven R and Khadam Hir Jordan A
Current Estimated Value
Home Financials for this Owner
Home Financials are based on the most recent Mortgage that was taken out on this home.
Original Mortgage
$241,544
Outstanding Balance
$167,946
Interest Rate
3.37%
Mortgage Type
FHA
Estimated Equity
$248,702
Purchase Details
Closed on
Jun 13, 2007
Sold by
David Weekley Homes Lp
Bought by
Hargrave Ronald Eugene and Hargrave Cecile A
Home Financials for this Owner
Home Financials are based on the most recent Mortgage that was taken out on this home.
Original Mortgage
$130,149
Interest Rate
6.15%
Mortgage Type
Purchase Money Mortgage
Purchase Details
Closed on
Dec 28, 2006
Sold by
Jdc / Firethorne Ltd
Bought by
Khadam-Hir Steven R and Khadam-Hir Jordan A
Create a Home Valuation Report for This Property
The Home Valuation Report is an in-depth analysis detailing your home's value as well as a comparison with similar homes in the area
Home Values in the Area
Average Home Value in this Area
Purchase History
| Date | Buyer | Sale Price | Title Company |
|---|---|---|---|
| Khadam Hir Steven R | -- | None Available | |
| Khadam-Hir Steven R | -- | -- | |
| Hargrave Ronald Eugene | -- | Priority Title Co | |
| Khadam-Hir Steven R | -- | -- | |
| Khadam-Hir Steven R | -- | -- |
Source: Public Records
Mortgage History
| Date | Status | Borrower | Loan Amount |
|---|---|---|---|
| Open | Khadam-Hir Steven R | $241,544 | |
| Previous Owner | Khadam-Hir Steven R | $130,149 |
Source: Public Records
Tax History Compared to Growth
Tax History
| Year | Tax Paid | Tax Assessment Tax Assessment Total Assessment is a certain percentage of the fair market value that is determined by local assessors to be the total taxable value of land and additions on the property. | Land | Improvement |
|---|---|---|---|---|
| 2025 | $7,482 | $407,678 | $67,600 | $340,078 |
| 2024 | $7,482 | $384,804 | $38,506 | $346,298 |
| 2023 | $7,482 | $349,822 | $459 | $349,363 |
| 2022 | $7,479 | $318,020 | $0 | $338,710 |
| 2021 | $7,790 | $289,110 | $52,000 | $237,110 |
| 2020 | $7,570 | $277,090 | $52,000 | $225,090 |
| 2019 | $8,005 | $273,160 | $50,000 | $223,160 |
| 2018 | $7,781 | $263,250 | $50,000 | $213,250 |
| 2017 | $7,978 | $266,770 | $50,000 | $216,770 |
| 2016 | $8,282 | $276,920 | $50,000 | $226,920 |
| 2015 | $4,535 | $257,920 | $50,000 | $207,920 |
| 2014 | $4,278 | $234,470 | $50,000 | $184,470 |
Source: Public Records
Map
Nearby Homes
- 2802 Helding Park Ct
- 28230 Daystrom Ln
- 2827 Fair Chase Dr
- 28226 S Firethorne Rd
- 28211 Crossprairie Dr
- 2943 Fair Chase Dr
- 28210 Chalet Park Dr
- 2531 Llano Springs Dr
- 2526 Llano Springs Dr
- 28407 Kinglet Pines Dr
- 28514 Rock Wren Ct
- 28119 Rusty Hawthorne Dr
- 28302 Hazel Trail
- 28514 Blue Holly Ln
- 28434 Eli Eagle St
- 28514 Eli Eagle St
- 28514 Hayden Park Dr
- 2714 Ember Pass Ln
- 28511 Eli Eagle St
- 28622 Blue Holly Ln
- 28238 Daystrom Ln
- 28246 Daystrom Ln
- 28234 Daystrom Ln
- 28250 Daystrom Ln
- 28254 Daystrom Ln
- 28247 Daystrom Ln
- 28243 Daystrom Ln
- 28251 Daystrom Ln
- 28255 Daystrom Ln
- 28226 Daystrom Ln
- 28258 Daystrom Ln
- 28235 Daystrom Ln
- 28222 S Firethorne Rd
- 28218 S Firethorne Rd
- 28231 Daystrom Ln
- 28222 Daystrom Ln
- 28238 Sweet Oak Ln
- 28242 Sweet Oak Ln
- 28234 Sweet Oak Ln
- 28263 Daystrom Ln