Estimated Value: $381,764 - $463,000
4
Beds
3
Baths
2,502
Sq Ft
$167/Sq Ft
Est. Value
About This Home
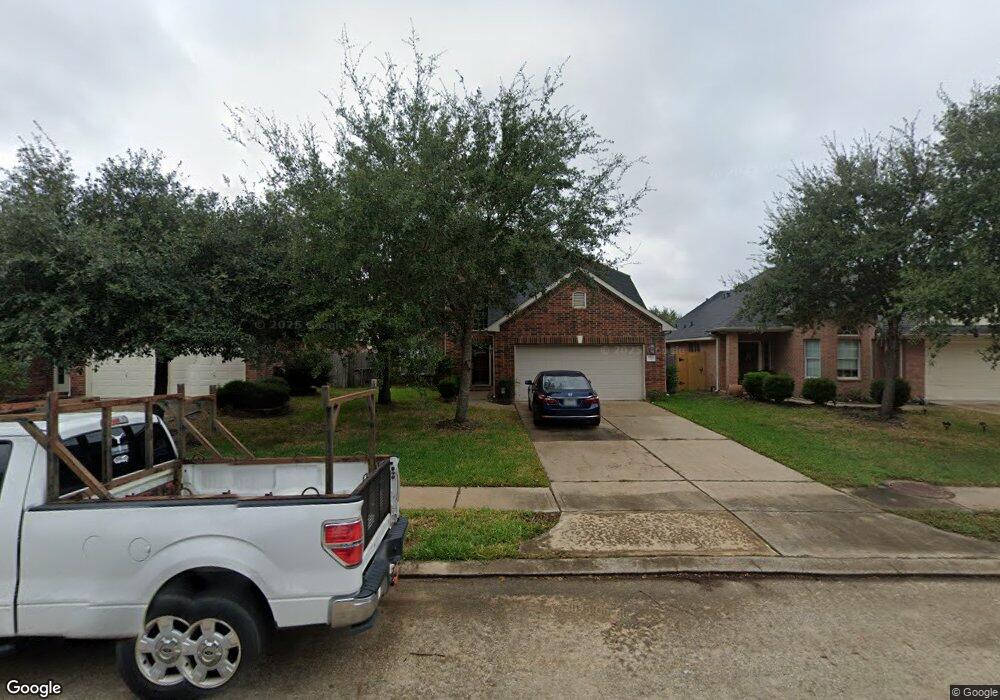
This home is located at 2826 Chalet Knolls Ln, Katy, TX 77494 and is currently estimated at $417,941, approximately $167 per square foot. 2826 Chalet Knolls Ln is a home located in Fort Bend County with nearby schools including Ray And Jamie Wolman Elementary School, Woodcreek Junior High School, and Katy High School.
Ownership History
Date
Name
Owned For
Owner Type
Purchase Details
Closed on
Jun 25, 2019
Sold by
Chapman Heather
Bought by
Chapman David
Current Estimated Value
Home Financials for this Owner
Home Financials are based on the most recent Mortgage that was taken out on this home.
Original Mortgage
$245,471
Outstanding Balance
$212,672
Interest Rate
3.4%
Mortgage Type
New Conventional
Estimated Equity
$205,269
Purchase Details
Closed on
Dec 21, 2015
Sold by
Dufour Brian S and Swanson Jennifer
Bought by
Chapman David B and Chapman Heather Lynn
Home Financials for this Owner
Home Financials are based on the most recent Mortgage that was taken out on this home.
Original Mortgage
$245,471
Interest Rate
4.03%
Mortgage Type
New Conventional
Purchase Details
Closed on
Jan 29, 2008
Sold by
Mhi Partnership
Bought by
Dufour Brian S and Swanson Jennifer S
Home Financials for this Owner
Home Financials are based on the most recent Mortgage that was taken out on this home.
Original Mortgage
$159,540
Interest Rate
6.15%
Mortgage Type
Purchase Money Mortgage
Purchase Details
Closed on
Nov 1, 2007
Sold by
Jdc/Firethorne Ltd
Bought by
Mhi Partnership Ltd
Create a Home Valuation Report for This Property
The Home Valuation Report is an in-depth analysis detailing your home's value as well as a comparison with similar homes in the area
Home Values in the Area
Average Home Value in this Area
Purchase History
| Date | Buyer | Sale Price | Title Company |
|---|---|---|---|
| Chapman David | -- | None Available | |
| Chapman David B | -- | Capital Title Of Texas | |
| Dufour Brian S | -- | Millennium Title | |
| Chapman David B | -- | -- | |
| Mhi Partnership Ltd | -- | Millennium Title Co | |
| Chapman David B | -- | -- |
Source: Public Records
Mortgage History
| Date | Status | Borrower | Loan Amount |
|---|---|---|---|
| Open | Chapman David | $245,471 | |
| Closed | Chapman David B | $245,471 | |
| Previous Owner | Chapman David B | $159,540 |
Source: Public Records
Tax History Compared to Growth
Tax History
| Year | Tax Paid | Tax Assessment Tax Assessment Total Assessment is a certain percentage of the fair market value that is determined by local assessors to be the total taxable value of land and additions on the property. | Land | Improvement |
|---|---|---|---|---|
| 2025 | $6,369 | $368,501 | $66,066 | $310,152 |
| 2024 | $6,369 | $335,001 | $25,923 | $309,078 |
| 2023 | $5,856 | $304,546 | $0 | $310,596 |
| 2022 | $6,443 | $276,860 | $0 | $279,870 |
| 2021 | $6,782 | $251,690 | $46,200 | $205,490 |
| 2020 | $6,525 | $238,840 | $42,000 | $196,840 |
| 2019 | $6,984 | $238,310 | $40,000 | $198,310 |
| 2018 | $6,904 | $233,600 | $40,000 | $193,600 |
| 2017 | $6,895 | $230,550 | $40,000 | $190,550 |
| 2016 | $7,203 | $240,860 | $40,000 | $200,860 |
| 2015 | $3,938 | $226,550 | $40,000 | $186,550 |
| 2014 | $3,730 | $205,950 | $40,000 | $165,950 |
Source: Public Records
Map
Nearby Homes
- 2827 Fair Chase Dr
- 2802 Helding Park Ct
- 28230 Daystrom Ln
- 28226 S Firethorne Rd
- 2943 Fair Chase Dr
- 28211 Crossprairie Dr
- 28210 Chalet Park Dr
- 28407 Kinglet Pines Dr
- 28514 Rock Wren Ct
- 28302 Hazel Trail
- 2531 Llano Springs Dr
- 2526 Llano Springs Dr
- 28514 Blue Holly Ln
- 28434 Eli Eagle St
- 28119 Rusty Hawthorne Dr
- 28514 Eli Eagle St
- 28511 Eli Eagle St
- 2714 Ember Pass Ln
- 28514 Hayden Park Dr
- 28622 Blue Holly Ln
- 2830 Chalet Knolls Ln
- 2822 Chalet Knolls Ln
- 2818 Chalet Knolls Ln
- 2834 Chalet Knolls Ln
- 2819 Fair Chase Dr
- 2823 Fair Chase Dr
- 2815 Fair Chase Dr
- 2811 Fair Chase Dr
- 2838 Chalet Knolls Ln
- 2814 Chalet Knolls Ln
- 2819 Chalet Knolls Ln
- 2807 Fair Chase Dr
- 2815 Chalet Knolls Ln
- 2823 Chalet Knolls Ln
- 2827 Chalet Knolls Ln
- 2831 Fair Chase Dr
- 2842 Chalet Knolls Ln
- 2810 Chalet Knolls Ln
- 2831 Chalet Knolls Ln
- 2803 Fair Chase Dr