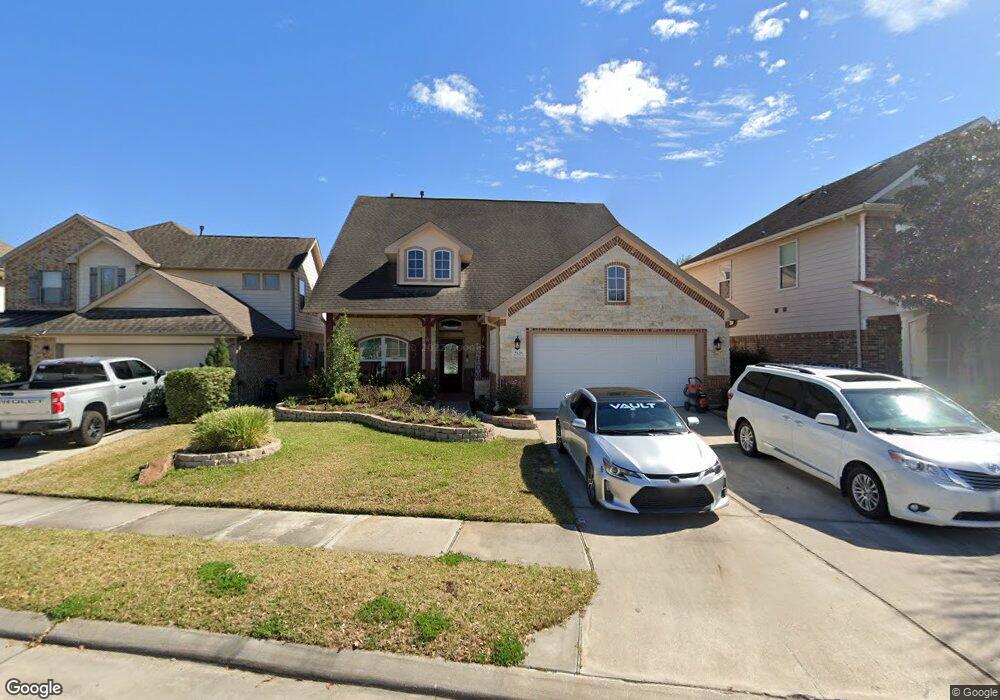
2826 Lockeridge Bend Dr Spring, TX 77386
Harmony NeighborhoodEstimated Value: $368,783 - $425,000
6
Beds
3
Baths
3,195
Sq Ft
$125/Sq Ft
Est. Value
About This Home
This home is located at 2826 Lockeridge Bend Dr, Spring, TX 77386 and is currently estimated at $400,446, approximately $125 per square foot. 2826 Lockeridge Bend Dr is a home located in Montgomery County with nearby schools including Snyder Elementary School, Cox Intermediate School, and York J High School.
Ownership History
Date
Name
Owned For
Owner Type
Purchase Details
Closed on
Oct 10, 2013
Sold by
James Richard C and James Molly D
Bought by
Kunka Ii Ronald Lee and Kunka Amy L
Current Estimated Value
Home Financials for this Owner
Home Financials are based on the most recent Mortgage that was taken out on this home.
Original Mortgage
$249,246
Outstanding Balance
$187,580
Interest Rate
4.54%
Mortgage Type
VA
Estimated Equity
$212,866
Purchase Details
Closed on
Dec 28, 2009
Sold by
Kriegen Holding Corp
Bought by
James Richard C and James Molly D
Home Financials for this Owner
Home Financials are based on the most recent Mortgage that was taken out on this home.
Original Mortgage
$202,268
Interest Rate
4.8%
Mortgage Type
FHA
Purchase Details
Closed on
Jun 8, 2009
Sold by
Wall Homes Texas Llc
Bought by
Kunka Ronald Lee and Kunka Amy L
Create a Home Valuation Report for This Property
The Home Valuation Report is an in-depth analysis detailing your home's value as well as a comparison with similar homes in the area
Home Values in the Area
Average Home Value in this Area
Purchase History
| Date | Buyer | Sale Price | Title Company |
|---|---|---|---|
| Kunka Ii Ronald Lee | -- | American Title Company | |
| James Richard C | -- | Charter Title Company | |
| Kunka Ronald Lee | -- | -- |
Source: Public Records
Mortgage History
| Date | Status | Borrower | Loan Amount |
|---|---|---|---|
| Open | Kunka Ii Ronald Lee | $249,246 | |
| Previous Owner | James Richard C | $202,268 |
Source: Public Records
Tax History Compared to Growth
Tax History
| Year | Tax Paid | Tax Assessment Tax Assessment Total Assessment is a certain percentage of the fair market value that is determined by local assessors to be the total taxable value of land and additions on the property. | Land | Improvement |
|---|---|---|---|---|
| 2025 | $4,381 | $343,000 | $30,447 | $312,553 |
| 2024 | $4,381 | $361,196 | -- | -- |
| 2023 | $6,205 | $328,360 | $30,450 | $367,550 |
| 2022 | $7,896 | $298,510 | $30,450 | $306,550 |
| 2021 | $7,649 | $271,370 | $30,450 | $240,920 |
| 2020 | $7,755 | $263,410 | $30,450 | $232,960 |
| 2019 | $8,123 | $269,470 | $30,450 | $249,960 |
| 2018 | $6,287 | $244,970 | $30,450 | $214,520 |
| 2017 | $7,378 | $244,970 | $30,450 | $214,520 |
| 2016 | $7,378 | $244,970 | $30,450 | $214,520 |
| 2015 | $6,025 | $226,190 | $30,450 | $201,850 |
| 2014 | $6,025 | $205,630 | $30,450 | $175,180 |
Source: Public Records
Map
Nearby Homes
- 28547 Lockeridge Springs Dr
- 1803 Riley Fuzzel Rd
- 3010 Lockeridge Village Dr
- 2207 Harmony Point Ln
- 29314 Legends Meade Dr
- 28618 Benders Crossing Dr
- 3226 Harmony Creek Ln
- 29023 Stone Fox Dr
- 29019 Comal Karst Dr
- 3622 Bluebonnet Trace Dr
- 2314 Marblecrest Ln
- 3522 Fuller Bluff Dr
- 3610 Rock Daisy Dr
- 3315 Legends Landing Dr
- 28826 Stapleford St
- 29402 Legends Hill Dr
- 29118 Raestone St
- 2534 Springstone Dr
- 3602 Avalon Castle Dr
- 28723 Sedgefield St
- 2830 Lockeridge Bend Dr
- 2822 Lockeridge Bend Dr
- 2818 Lockeridge Bend Dr
- 2834 Lockeridge Bend Dr
- 2819 Lockeridge Place Dr
- 2823 Lockeridge Place Dr
- 2815 Lockeridge Place Dr
- 2814 Lockeridge Bend Dr
- 2831 Lockeridge Bend Dr
- 2827 Lockeridge Place Dr
- 2827 Lockeridge Bend Dr
- 2835 Lockeridge Bend Dr
- 28638 Lockeridge Farms Dr
- 2810 Lockeridge Bend Dr
- 28634 Lockeridge Farms Dr
- 2823 Lockeridge Bend Dr
- 2819 Lockeridge Bend Dr
- 28630 Lockeridge Farms Dr
- 2815 Lockeridge Bend Dr
- 2807 Lockeridge Place Dr