Estimated Value: $823,000 - $1,212,000
4
Beds
3
Baths
3,920
Sq Ft
$248/Sq Ft
Est. Value
About This Home
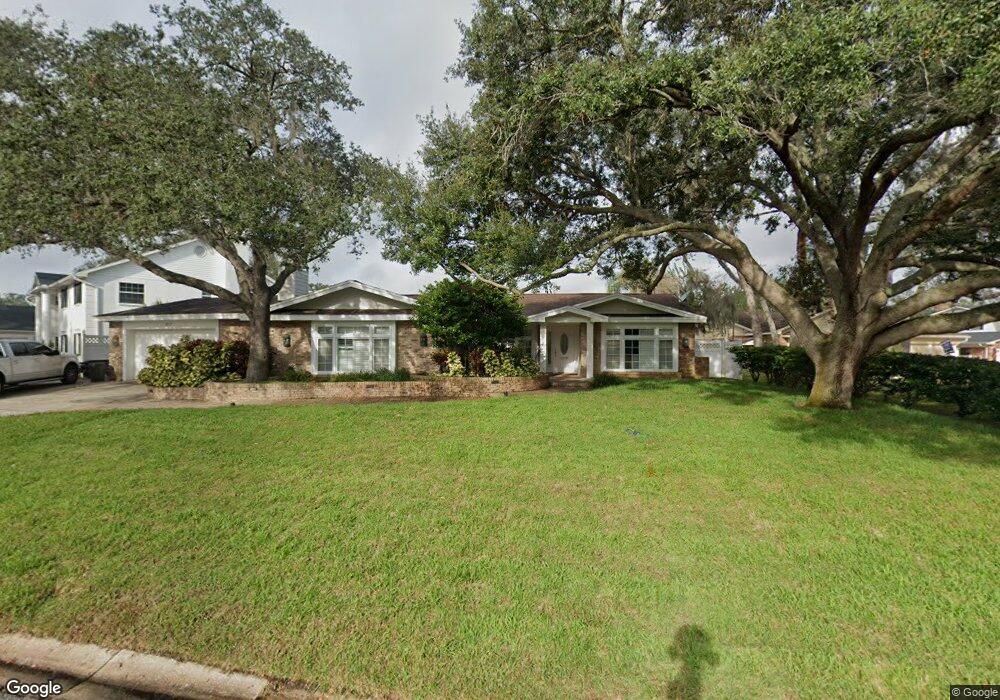
This home is located at 2827 Samara Dr, Tampa, FL 33618 and is currently estimated at $972,588, approximately $248 per square foot. 2827 Samara Dr is a home located in Hillsborough County with nearby schools including Carrollwood Elementary School, Chamberlain High School, and Corbett Preparatory School of IDS.
Ownership History
Date
Name
Owned For
Owner Type
Purchase Details
Closed on
Feb 9, 2018
Sold by
Massey Brad T and Massey Laureen E
Bought by
Massey Brad Thomas and Massey Lauren Elizabeth
Current Estimated Value
Purchase Details
Closed on
Oct 29, 2010
Sold by
Pirkle Richard A
Bought by
Massey Brad T and Massey Lauren E
Home Financials for this Owner
Home Financials are based on the most recent Mortgage that was taken out on this home.
Original Mortgage
$292,000
Outstanding Balance
$193,735
Interest Rate
4.38%
Mortgage Type
New Conventional
Estimated Equity
$778,853
Purchase Details
Closed on
Nov 20, 2007
Sold by
Pirkle Richard A and Pirkle Richelle R
Bought by
Pirkle Richard A
Purchase Details
Closed on
Oct 24, 1995
Sold by
Tyrrell David R
Bought by
Pirkle Richard A and Pirkle Richelle R
Home Financials for this Owner
Home Financials are based on the most recent Mortgage that was taken out on this home.
Original Mortgage
$190,000
Interest Rate
7.57%
Mortgage Type
New Conventional
Create a Home Valuation Report for This Property
The Home Valuation Report is an in-depth analysis detailing your home's value as well as a comparison with similar homes in the area
Home Values in the Area
Average Home Value in this Area
Purchase History
| Date | Buyer | Sale Price | Title Company |
|---|---|---|---|
| Massey Brad Thomas | -- | Attorney | |
| Massey Brad T | $365,000 | Westchase Title Llc | |
| Pirkle Richard A | -- | Attorney | |
| Pirkle Richard A | $290,000 | -- |
Source: Public Records
Mortgage History
| Date | Status | Borrower | Loan Amount |
|---|---|---|---|
| Open | Massey Brad T | $292,000 | |
| Previous Owner | Pirkle Richard A | $95,000 | |
| Previous Owner | Pirkle Richard A | $275,000 | |
| Previous Owner | Pirkle Richard A | $190,000 |
Source: Public Records
Tax History Compared to Growth
Tax History
| Year | Tax Paid | Tax Assessment Tax Assessment Total Assessment is a certain percentage of the fair market value that is determined by local assessors to be the total taxable value of land and additions on the property. | Land | Improvement |
|---|---|---|---|---|
| 2024 | $8,128 | $424,942 | -- | -- |
| 2023 | $7,893 | $412,565 | $0 | $0 |
| 2022 | $7,621 | $400,549 | $0 | $0 |
| 2021 | $7,242 | $383,361 | $0 | $0 |
| 2020 | $7,132 | $378,068 | $0 | $0 |
| 2019 | $6,986 | $369,568 | $0 | $0 |
| 2018 | $5,902 | $309,663 | $0 | $0 |
| 2017 | $5,836 | $363,847 | $0 | $0 |
| 2016 | $5,792 | $297,056 | $0 | $0 |
| 2015 | $5,852 | $294,991 | $0 | $0 |
| 2014 | $5,823 | $292,650 | $0 | $0 |
| 2013 | -- | $288,325 | $0 | $0 |
Source: Public Records
Map
Nearby Homes
- 3026 Samara Dr
- 10305 Orange Grove Dr
- 10504 Lacera Dr
- 3307 Nakora Dr
- 2905 Safe Harbor Dr
- 10910 Carrollwood Dr
- 2321 Carroll Grove Dr
- 10310 Carroll Cove Place
- 3407 W Busch Blvd
- 10403 Lake Carroll Way
- 9722 Tiffany Oaks Ln Unit 14
- 9586 Troutwater Ln
- 2 Troutwater Ln Troutwater Ln
- 10408 Butia Place
- 9516 Citrus Glen Place Unit 43
- 9519 Citrus Glen Place
- 10310 N Oakleaf Ave
- 9519 Orange Valley Ct
- 10356 Carrollwood Ln Unit 204
- 10604 Carrollbrook Ln