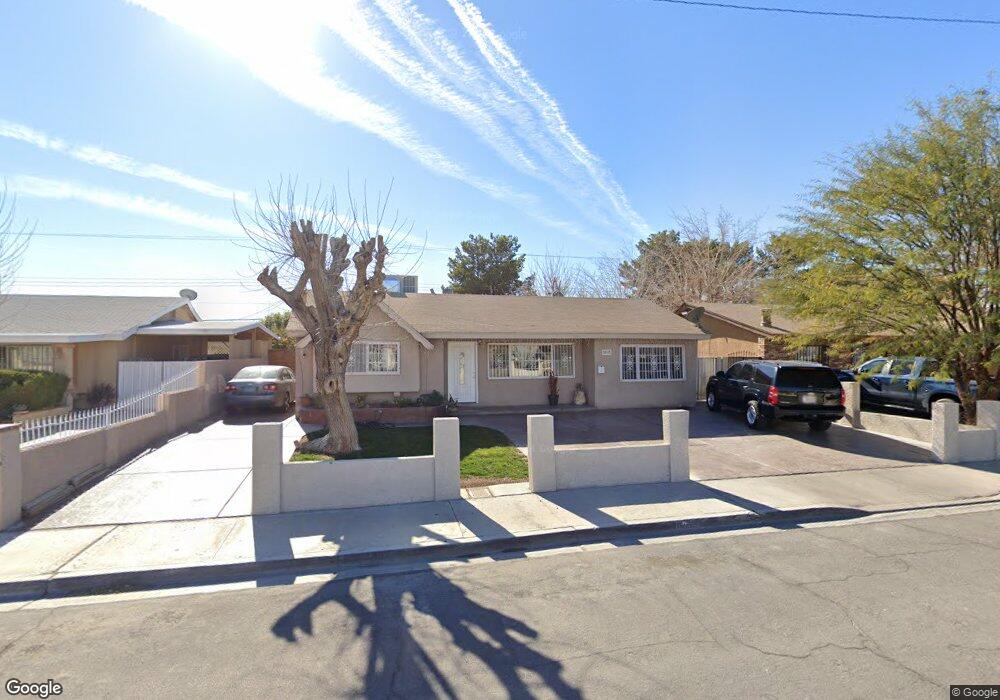
2832 Willoughby Ave Las Vegas, NV 89101
East Las Vegas NeighborhoodEstimated Value: $271,000 - $332,000
3
Beds
1
Bath
1,269
Sq Ft
$245/Sq Ft
Est. Value
About This Home
This home is located at 2832 Willoughby Ave, Las Vegas, NV 89101 and is currently estimated at $311,206, approximately $245 per square foot. 2832 Willoughby Ave is a home located in Clark County with nearby schools including Arturo Cambeiro Elementary School, J.D. Smith Middle School, and Desert Pines High School.
Ownership History
Date
Name
Owned For
Owner Type
Purchase Details
Closed on
May 28, 2025
Sold by
Valencia Francisco E and Valencia Raquel
Bought by
Valencia Family Revocable Living Trust and Valencia
Current Estimated Value
Purchase Details
Closed on
Aug 29, 2000
Sold by
Velazoo Leonel and Velazoo Victor S
Bought by
Valencia Francisco E and Valencia Raquel
Home Financials for this Owner
Home Financials are based on the most recent Mortgage that was taken out on this home.
Original Mortgage
$97,850
Interest Rate
8.2%
Mortgage Type
FHA
Purchase Details
Closed on
Apr 26, 1996
Sold by
Curiel Margarita
Bought by
Velazco Leonel
Home Financials for this Owner
Home Financials are based on the most recent Mortgage that was taken out on this home.
Original Mortgage
$68,712
Interest Rate
7.82%
Mortgage Type
FHA
Purchase Details
Closed on
Feb 14, 1995
Sold by
Becker Barton R and Becker Margaret M L
Bought by
Margo Investments Ltd Liability Company
Create a Home Valuation Report for This Property
The Home Valuation Report is an in-depth analysis detailing your home's value as well as a comparison with similar homes in the area
Home Values in the Area
Average Home Value in this Area
Purchase History
| Date | Buyer | Sale Price | Title Company |
|---|---|---|---|
| Valencia Family Revocable Living Trust | -- | None Listed On Document | |
| Valencia Francisco E | $98,000 | Old Republic Title Company | |
| Velazco Leonel | -- | United Title | |
| Velazco Leonel | $69,000 | United Title | |
| Margo Investments Ltd Liability Company | -- | -- |
Source: Public Records
Mortgage History
| Date | Status | Borrower | Loan Amount |
|---|---|---|---|
| Previous Owner | Valencia Francisco E | $97,850 | |
| Previous Owner | Velazco Leonel | $68,712 |
Source: Public Records
Tax History Compared to Growth
Tax History
| Year | Tax Paid | Tax Assessment Tax Assessment Total Assessment is a certain percentage of the fair market value that is determined by local assessors to be the total taxable value of land and additions on the property. | Land | Improvement |
|---|---|---|---|---|
| 2025 | $613 | $42,366 | $25,900 | $16,466 |
| 2024 | $596 | $42,366 | $25,900 | $16,466 |
| 2023 | $596 | $42,138 | $27,300 | $14,838 |
| 2022 | $578 | $36,731 | $23,450 | $13,281 |
| 2021 | $587 | $29,832 | $17,500 | $12,332 |
| 2020 | $542 | $27,742 | $15,750 | $11,992 |
| 2019 | $508 | $26,621 | $15,050 | $11,571 |
| 2018 | $485 | $23,800 | $12,950 | $10,850 |
| 2017 | $743 | $22,650 | $11,900 | $10,750 |
| 2016 | $456 | $18,459 | $8,050 | $10,409 |
| 2015 | $453 | $15,695 | $5,600 | $10,095 |
| 2014 | $440 | $14,186 | $4,200 | $9,986 |
Source: Public Records
Map
Nearby Homes
- 2624 Brady Ave Unit 1
- 2932 Demetrius Ave
- 0 Mcknight St
- 1304 Melissa St
- 2600 E Bonanza Rd
- 1203 Mews Ln
- 1226 Coach Ln
- 2317 Kirk Ave Unit 4
- 921 Delta St
- 1413 N Mojave Rd
- 3204 Osage Ave
- 3212 Osage Ave
- 520 N 28th St
- 920 E Bonanza Rd
- 828 N 21st St
- 506 Wardelle St Unit C
- 3205 Mary Ann Ave
- 3320 Osage Ave
- 709 N 22nd St
- 2915 Cedar Ave Unit 11C
- 2836 Willoughby Ave
- 2828 Willoughby Ave
- 2840 Willoughby Ave
- 2824 Willoughby Ave
- 2833 Willoughby Ave
- 2829 Willoughby Ave
- 2837 Willoughby Ave
- 2820 Willoughby Ave
- 2844 Willoughby Ave
- 2825 Willoughby Ave
- 2841 Willoughby Ave
- 2845 Willoughby Ave
- 2821 Willoughby Ave
- 2816 Willoughby Ave
- 2848 Willoughby Ave
- 2832 Constantine Ave
- 2836 Constantine Ave
- 2828 Constantine Ave
- 2840 Constantine Ave
- 2824 Constantine Ave