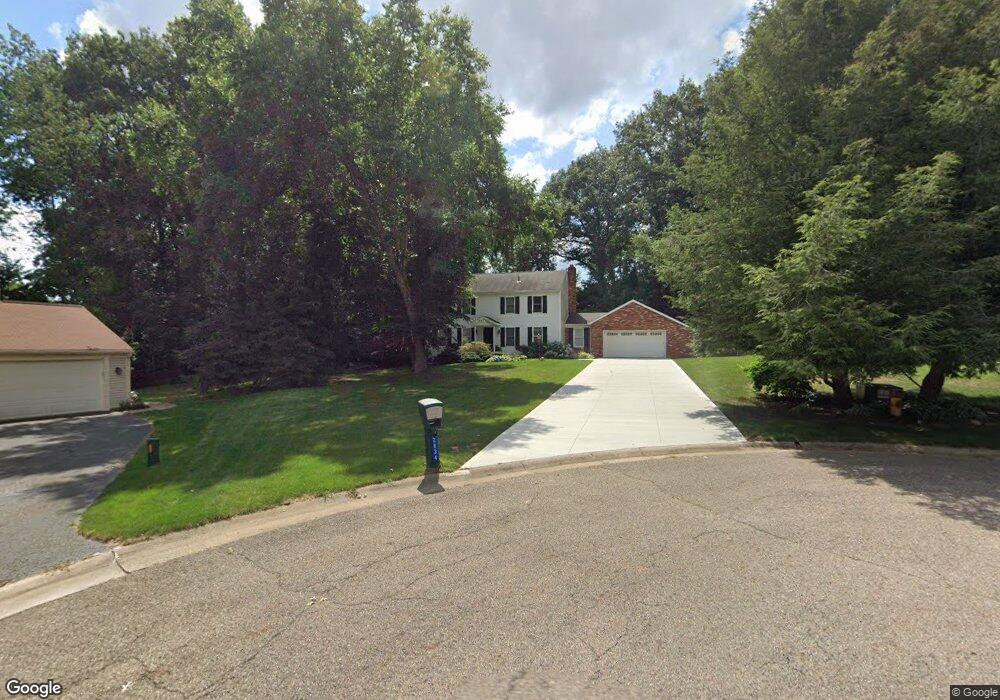
2834 Waterbury St NW North Canton, OH 44720
Estimated Value: $337,000 - $389,000
4
Beds
3
Baths
2,400
Sq Ft
$153/Sq Ft
Est. Value
About This Home
This home is located at 2834 Waterbury St NW, North Canton, OH 44720 and is currently estimated at $368,212, approximately $153 per square foot. 2834 Waterbury St NW is a home located in Stark County with nearby schools including Northwood Elementary School, North Canton Middle School, and Hoover High School.
Ownership History
Date
Name
Owned For
Owner Type
Purchase Details
Closed on
Sep 17, 1999
Sold by
Bentley James D and Bentley Katherine H
Bought by
Fernandez Leopold A and Fernandez Catherine M
Current Estimated Value
Home Financials for this Owner
Home Financials are based on the most recent Mortgage that was taken out on this home.
Original Mortgage
$132,200
Outstanding Balance
$39,524
Interest Rate
7.93%
Mortgage Type
Purchase Money Mortgage
Estimated Equity
$328,688
Purchase Details
Closed on
Jun 22, 1995
Sold by
Reiner Robert W
Bought by
Bentley James D and Bentley Katherine
Home Financials for this Owner
Home Financials are based on the most recent Mortgage that was taken out on this home.
Original Mortgage
$130,000
Interest Rate
7.9%
Mortgage Type
New Conventional
Create a Home Valuation Report for This Property
The Home Valuation Report is an in-depth analysis detailing your home's value as well as a comparison with similar homes in the area
Home Values in the Area
Average Home Value in this Area
Purchase History
| Date | Buyer | Sale Price | Title Company |
|---|---|---|---|
| Fernandez Leopold A | $180,000 | Americas Choice Title Agency | |
| Bentley James D | $162,500 | -- |
Source: Public Records
Mortgage History
| Date | Status | Borrower | Loan Amount |
|---|---|---|---|
| Open | Fernandez Leopold A | $132,200 | |
| Closed | Bentley James D | $130,000 | |
| Closed | Fernandez Leopold A | $79,200 |
Source: Public Records
Tax History Compared to Growth
Tax History
| Year | Tax Paid | Tax Assessment Tax Assessment Total Assessment is a certain percentage of the fair market value that is determined by local assessors to be the total taxable value of land and additions on the property. | Land | Improvement |
|---|---|---|---|---|
| 2025 | -- | $126,420 | $37,450 | $88,970 |
| 2024 | -- | $126,420 | $37,450 | $88,970 |
| 2023 | $5,289 | $90,340 | $26,010 | $64,330 |
| 2022 | $3,005 | $90,340 | $26,010 | $64,330 |
| 2021 | $3,167 | $90,340 | $26,010 | $64,330 |
| 2020 | $4,929 | $77,840 | $22,400 | $55,440 |
| 2019 | $4,646 | $77,840 | $22,400 | $55,440 |
| 2018 | $4,796 | $77,840 | $22,400 | $55,440 |
| 2017 | $4,155 | $69,200 | $19,670 | $49,530 |
| 2016 | $4,173 | $69,200 | $19,670 | $49,530 |
| 2015 | $4,049 | $69,200 | $19,670 | $49,530 |
| 2014 | $1,806 | $62,620 | $17,820 | $44,800 |
| 2013 | $1,860 | $62,620 | $17,820 | $44,800 |
Source: Public Records
Map
Nearby Homes
- 7840 Newgate Ave NW
- 8037 Norriton Cir NW
- 7831 Windbur Cir NW
- 2774 Bridlewood St NW
- 2626 Northam Cir NW
- 2677 Radford St NW
- 3077 Whitewood St NW
- 7995 Woodrush Dr NW
- 2684 Fordham Cir NW
- 2452 Purdue Cir NW
- 2315 Rutgers St NW
- 8173 Spencer Ave NW
- 2840 Barclay Cir NW
- 434 Heather Cir NE
- 1350 Overland Ave NE
- 3278 Sumser St NW Unit 2
- 1263 Los Angeles Blvd NW
- 1060 Park Ave NE
- 2884 Sutherland Cir NW
- 3858 Cranwood St NW
- 2826 Waterbury St NW
- 2835 Waterbury St NW
- 7824 Campton Cir NW
- 7780 Dayspring Cir NW
- 7769 Dayspring Cir NW
- 7812 Campton Cir NW
- 7836 Campton Cir NW
- 2825 Waterbury St NW
- 2814 Waterbury St NW
- 7796 Campton Cir NW
- 7886 Killington Ave NW
- 7768 Dayspring Cir NW
- 2840 River Run Cir NW
- 2811 Waterbury St NW
- 7782 Campton Cir NW
- 2800 Waterbury St NW
- 7757 Dayspring Cir NW
- 7837 Campton Cir NW
- 2850 River Run Cir NW
- 7900 Killington Ave NW