2840 Dyer Long Rd Cookeville, TN 38501
Estimated Value: $326,000 - $546,000
--
Bed
2
Baths
2,622
Sq Ft
$161/Sq Ft
Est. Value
About This Home
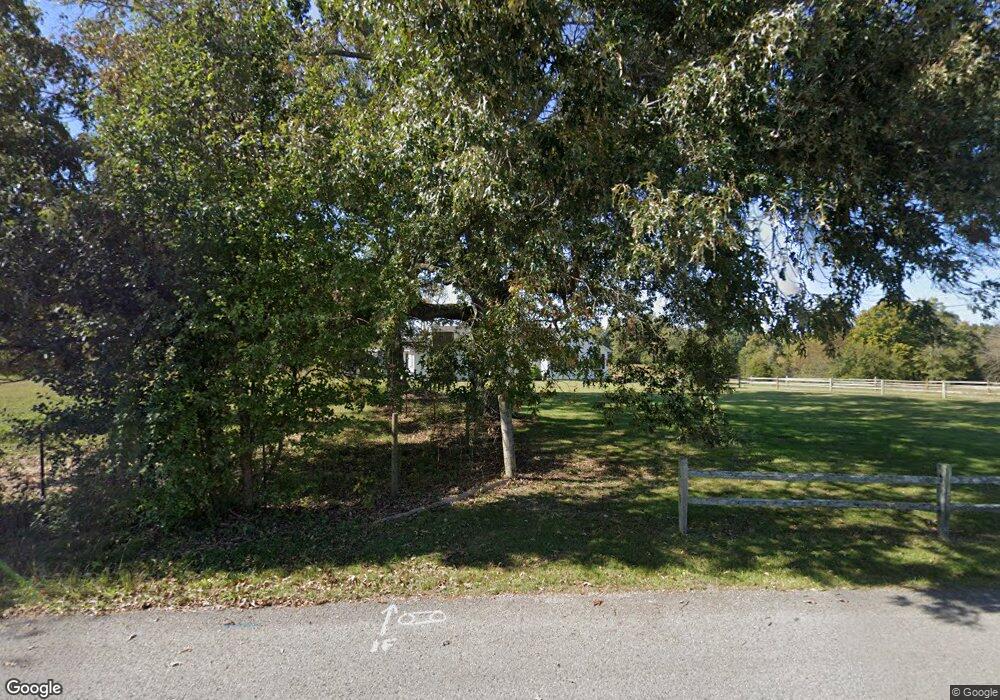
This home is located at 2840 Dyer Long Rd, Cookeville, TN 38501 and is currently estimated at $420,949, approximately $160 per square foot. 2840 Dyer Long Rd is a home located in Putnam County with nearby schools including Cane Creek Elementary School, Upperman Middle School, and Upperman High School.
Ownership History
Date
Name
Owned For
Owner Type
Purchase Details
Closed on
Mar 1, 2001
Sold by
Collier Carter A and Collier Ruth A
Bought by
Peters Scott E and Peters Marian K
Current Estimated Value
Purchase Details
Closed on
Nov 30, 1999
Sold by
Carter Collier W and Carter Ruth
Bought by
Malone Charles E and Malone Shirley
Purchase Details
Closed on
Oct 15, 1999
Sold by
Meadows Eddie L and Meadows Brenda
Bought by
Carter Collier W and Carter Ruth
Purchase Details
Closed on
Dec 16, 1998
Sold by
Mary Elliott
Bought by
Meadows Eddie L and Meadows Brenda
Purchase Details
Closed on
Dec 29, 1995
Sold by
May Elliott Laura
Bought by
Mary Elliott
Purchase Details
Closed on
Apr 26, 1994
Sold by
Partin Darrell W
Bought by
May Elliott Laura
Purchase Details
Closed on
Jun 18, 1993
Bought by
Elliott Laura May
Purchase Details
Closed on
Jun 5, 1970
Bought by
Eller Beecher and Eller Magdalene
Purchase Details
Closed on
Aug 15, 1969
Create a Home Valuation Report for This Property
The Home Valuation Report is an in-depth analysis detailing your home's value as well as a comparison with similar homes in the area
Home Values in the Area
Average Home Value in this Area
Purchase History
| Date | Buyer | Sale Price | Title Company |
|---|---|---|---|
| Peters Scott E | $162,000 | -- | |
| Malone Charles E | $1,500 | -- | |
| Carter Collier W | $147,000 | -- | |
| Meadows Eddie L | -- | -- | |
| Mary Elliott | -- | -- | |
| May Elliott Laura | $18,450 | -- | |
| Elliott Laura May | $100,000 | -- | |
| Eller Beecher | -- | -- | |
| -- | -- | -- |
Source: Public Records
Tax History Compared to Growth
Tax History
| Year | Tax Paid | Tax Assessment Tax Assessment Total Assessment is a certain percentage of the fair market value that is determined by local assessors to be the total taxable value of land and additions on the property. | Land | Improvement |
|---|---|---|---|---|
| 2024 | $1,552 | $58,350 | $7,800 | $50,550 |
| 2023 | $1,552 | $58,350 | $7,800 | $50,550 |
| 2022 | $1,442 | $58,350 | $7,800 | $50,550 |
| 2021 | $1,442 | $58,350 | $7,800 | $50,550 |
| 2020 | $1,240 | $58,350 | $7,800 | $50,550 |
| 2019 | $1,153 | $42,375 | $7,250 | $35,125 |
| 2018 | $1,076 | $39,400 | $7,250 | $32,150 |
| 2017 | $1,117 | $39,400 | $7,250 | $32,150 |
| 2016 | $1,117 | $40,900 | $8,750 | $32,150 |
| 2015 | $1,147 | $40,900 | $8,750 | $32,150 |
| 2014 | $1,131 | $40,317 | $0 | $0 |
Source: Public Records
Map
Nearby Homes
- 2907 Oakdale Cir
- 2508 Westowne Ave
- 3134 Westowne Cir
- 3180 Westowne Cir
- 4228 Gainesboro Grade
- 3030 Westowne Cir
- 3022 Westowne Cir
- 4000 Gainesboro Grade
- 3013 Tulip Ln
- 2770 Autumn Woods Trail
- 1475 Dyer Creek Rd
- 2617 Spring Arbor Ct
- 2694 Whispering Oaks Ln
- 2600 Whispering Oaks Ln
- 2636 Whispering Oaks Ln
- 4028 Winter Haven Dr
- 2895 Autumn Woods Trail
- 2870 Autumn Woods Trail
- 2450 Whispering Oaks Ln
- 2618 Whispering Oak Ln
- 2915 Dyer Long Rd
- 2960 Dyer Long Rd
- 3010 Oakdale Dr
- 3008 Oakdale Dr
- 2993 Dyer Long Rd
- 3024 Dyer Long Rd
- 3035 Dyer Long Rd
- 2922 Oakdale Cir
- Lot 46 Oakdale Cir
- 2800 Dyer Long Rd
- 2915 Oakdale Cir
- 2914 Oakdale Cir
- 2927 Oakdale Cir
- 3112 Dyer Long Rd
- 2913 Oakdale Cir
- 2912 Oakdale Cir
- 4950 Gainesboro Grade
- 3113 Dyer Long Rd
- 2530 Dyer Long Rd
- 2909 Oakdale Cir