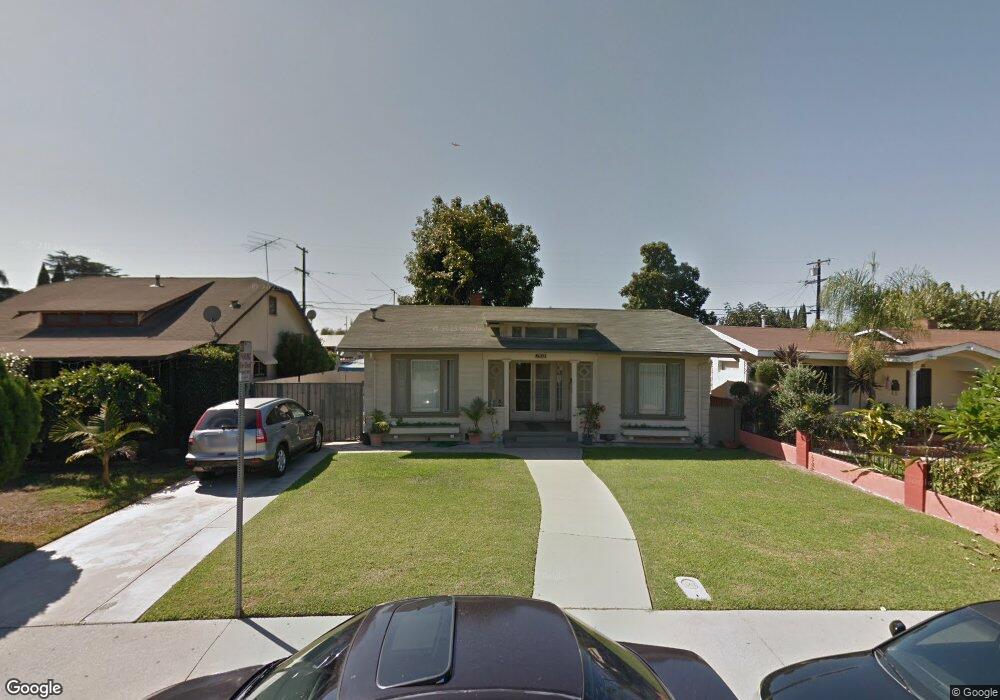
2848 Live Oak St Huntington Park, CA 90255
Walnut Park NeighborhoodEstimated Value: $612,000 - $789,000
2
Beds
1
Bath
922
Sq Ft
$729/Sq Ft
Est. Value
About This Home
This home is located at 2848 Live Oak St, Huntington Park, CA 90255 and is currently estimated at $672,309, approximately $729 per square foot. 2848 Live Oak St is a home located in Los Angeles County with nearby schools including Hope Street Elementary School, Walnut Park Middle School, and Huntington Park Senior High School.
Ownership History
Date
Name
Owned For
Owner Type
Purchase Details
Closed on
Sep 9, 2014
Sold by
Rodriguez Adriana C
Bought by
Rodriguez Adriana G and Sanchez Vanessa Joann
Current Estimated Value
Home Financials for this Owner
Home Financials are based on the most recent Mortgage that was taken out on this home.
Original Mortgage
$125,000
Outstanding Balance
$95,519
Interest Rate
4.09%
Mortgage Type
New Conventional
Estimated Equity
$576,790
Purchase Details
Closed on
Apr 18, 2003
Sold by
Sanchez Jose and Rodriguez Adriana G
Bought by
Rodriguez Adriana G
Home Financials for this Owner
Home Financials are based on the most recent Mortgage that was taken out on this home.
Original Mortgage
$121,000
Interest Rate
5.54%
Mortgage Type
Credit Line Revolving
Purchase Details
Closed on
Sep 13, 1995
Sold by
Sanchez Jorge
Bought by
Sanchez Jose
Purchase Details
Closed on
Mar 24, 1995
Sold by
Runge Arbutus I
Bought by
Sanchez Jose
Home Financials for this Owner
Home Financials are based on the most recent Mortgage that was taken out on this home.
Original Mortgage
$107,880
Interest Rate
8.9%
Create a Home Valuation Report for This Property
The Home Valuation Report is an in-depth analysis detailing your home's value as well as a comparison with similar homes in the area
Home Values in the Area
Average Home Value in this Area
Purchase History
| Date | Buyer | Sale Price | Title Company |
|---|---|---|---|
| Rodriguez Adriana G | -- | Pacific Coast Title Company | |
| Rodriguez Adriana G | -- | Fidelity National Title Co | |
| Sanchez Jose | -- | -- | |
| Sanchez Jose | $120,000 | Title Land Co |
Source: Public Records
Mortgage History
| Date | Status | Borrower | Loan Amount |
|---|---|---|---|
| Open | Rodriguez Adriana G | $125,000 | |
| Closed | Rodriguez Adriana G | $121,000 | |
| Previous Owner | Sanchez Jose | $107,880 |
Source: Public Records
Tax History Compared to Growth
Tax History
| Year | Tax Paid | Tax Assessment Tax Assessment Total Assessment is a certain percentage of the fair market value that is determined by local assessors to be the total taxable value of land and additions on the property. | Land | Improvement |
|---|---|---|---|---|
| 2025 | $3,572 | $222,409 | $173,305 | $49,104 |
| 2024 | $3,572 | $218,049 | $169,907 | $48,142 |
| 2023 | $3,433 | $213,775 | $166,576 | $47,199 |
| 2022 | $3,246 | $209,584 | $163,310 | $46,274 |
| 2021 | $3,155 | $205,475 | $160,108 | $45,367 |
| 2019 | $3,066 | $199,382 | $155,360 | $44,022 |
| 2018 | $2,969 | $195,473 | $152,314 | $43,159 |
| 2016 | $2,843 | $187,884 | $146,400 | $41,484 |
| 2015 | $2,801 | $185,062 | $144,201 | $40,861 |
| 2014 | $2,804 | $181,438 | $141,377 | $40,061 |
Source: Public Records
Map
Nearby Homes
- 2749 Live Oak St
- 2829 California St
- 2930 Live Oak St
- 2712 California St
- 3007 Flower St
- 2742 Olive St
- 7223 Seville Ave
- 7126 Stafford Ave
- 2912 Hill St
- 7015 Templeton St
- 2806 Cudahy St
- 6900 Templeton St
- 7018 Rita Ave Unit 206
- 7018 Rita Ave Unit 404
- 2526 Flower St
- 3107 Hill St
- 4 beds/ 3.5 baths Plan at Alma Homes
- 3 bed/ 2.5 baths Plan at Alma Homes
- 3037 Cudahy St
- 3152 Olive St
- 2852 Live Oak St
- 2842 Live Oak St
- 2838 Live Oak St
- 2858 Live Oak St
- 2849 Flower St
- 2843 Flower St
- 2853 Flower St
- 2834 Live Oak St
- 2862 Live Oak St
- 2839 Flower St
- 2859 Flower St
- 2828 Live Oak St
- 2849 Live Oak St
- 2835 Flower St
- 2853 Live Oak St
- 2843 Live Oak St
- 2863 Flower St
- 2859 Live Oak St
- 2837 Live Oak St
- 2824 Live Oak St