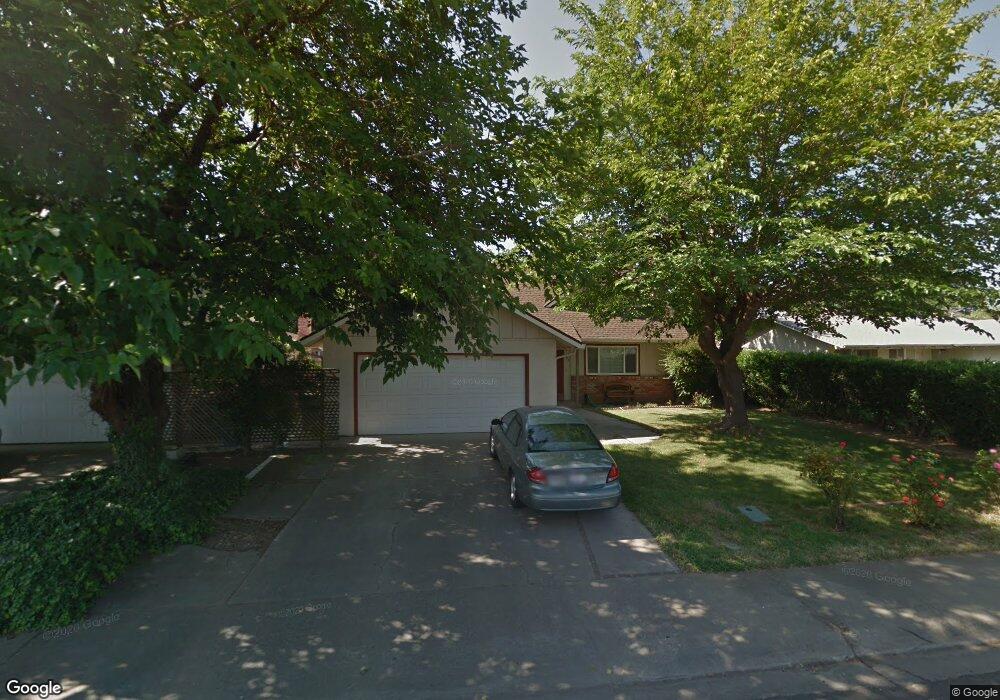
285 Chestnut St Woodland, CA 95695
Estimated Value: $323,000 - $532,723
4
Beds
2
Baths
2,000
Sq Ft
$230/Sq Ft
Est. Value
About This Home
This home is located at 285 Chestnut St, Woodland, CA 95695 and is currently estimated at $460,681, approximately $230 per square foot. 285 Chestnut St is a home located in Yolo County with nearby schools including Rhoda Maxwell Elementary School, Lee Middle School, and Woodland Senior High School.
Ownership History
Date
Name
Owned For
Owner Type
Purchase Details
Closed on
Dec 21, 2023
Sold by
Kelly Katherine A and Kelly Natalie G
Bought by
Bare Bricks Inc
Current Estimated Value
Purchase Details
Closed on
Mar 22, 2009
Sold by
Central Mortgage Company
Bought by
Kelly Katherine A and Kelly Natalie G
Purchase Details
Closed on
Jul 17, 2008
Sold by
Vera Rogelio
Bought by
Central Mortgage Co and Central Mortgage Loan Servicing Co
Purchase Details
Closed on
Mar 29, 2005
Sold by
Hurtado Irma
Bought by
Vera Rogelio
Home Financials for this Owner
Home Financials are based on the most recent Mortgage that was taken out on this home.
Original Mortgage
$303,200
Interest Rate
5.62%
Mortgage Type
Purchase Money Mortgage
Purchase Details
Closed on
Mar 8, 2005
Sold by
Zeck Douglas L and Zeck Janice M
Bought by
Vera Rogelio
Home Financials for this Owner
Home Financials are based on the most recent Mortgage that was taken out on this home.
Original Mortgage
$303,200
Interest Rate
5.62%
Mortgage Type
Purchase Money Mortgage
Create a Home Valuation Report for This Property
The Home Valuation Report is an in-depth analysis detailing your home's value as well as a comparison with similar homes in the area
Home Values in the Area
Average Home Value in this Area
Purchase History
| Date | Buyer | Sale Price | Title Company |
|---|---|---|---|
| Bare Bricks Inc | $99,000 | Lennar Title | |
| Kelly Katherine A | $182,500 | Fidelity National Title Co | |
| Kelly Katherine A | -- | Fidelity National Title Co | |
| Central Mortgage Co | $265,000 | Accommodation | |
| Vera Rogelio | -- | North American Title | |
| Vera Rogelio | $379,000 | North American Title |
Source: Public Records
Mortgage History
| Date | Status | Borrower | Loan Amount |
|---|---|---|---|
| Previous Owner | Vera Rogelio | $303,200 | |
| Closed | Vera Rogelio | $75,800 |
Source: Public Records
Tax History Compared to Growth
Tax History
| Year | Tax Paid | Tax Assessment Tax Assessment Total Assessment is a certain percentage of the fair market value that is determined by local assessors to be the total taxable value of land and additions on the property. | Land | Improvement |
|---|---|---|---|---|
| 2025 | $3,943 | $382,500 | $112,200 | $270,300 |
| 2023 | $3,943 | $225,394 | $99,013 | $126,381 |
| 2022 | $2,323 | $220,975 | $97,072 | $123,903 |
| 2021 | $2,286 | $216,643 | $95,169 | $121,474 |
| 2020 | $2,253 | $214,423 | $94,194 | $120,229 |
| 2019 | $2,211 | $210,220 | $92,348 | $117,872 |
| 2018 | $2,189 | $206,099 | $90,538 | $115,561 |
| 2017 | $2,141 | $202,059 | $88,763 | $113,296 |
| 2016 | $2,294 | $198,098 | $87,023 | $111,075 |
| 2015 | $2,034 | $195,123 | $85,716 | $109,407 |
| 2014 | $2,034 | $191,301 | $84,037 | $107,264 |
Source: Public Records
Map
Nearby Homes
- 116 Imperial St
- 2 King Place
- 736 W Lincoln Ave Unit 138
- 6 Dawn Dr
- 805 W Lincoln Ave
- 23 Azure Place
- 0 Hwy 16 Unit 224027849
- 0 Hwy 16 Unit 225136544
- 517 Daniels St
- 737 Heather Ln
- 382 Bright Day Dr
- 956 W Cross St
- 742 W Cross St
- 56 W Elliot St Unit 61
- 147 W Woodland Ave
- 49 Antelope St
- 725 Fairview Dr
- 148 Glacier St
- 20 W Clover St
- 628 California St
- 281 Chestnut St
- 289 Chestnut St
- 286 Riverside Dr
- 290 Riverside Dr
- 293 Chestnut St
- 282 Riverside Dr
- 277 Chestnut St
- 204 Alpine Place
- 294 Riverside Dr
- 278 Riverside Dr
- 205 Ashley Ave
- 273 Chestnut St
- 200 Alpine Place
- 205 Alpine Place
- 274 Riverside Dr
- 201 Ashley Ave
- 269 Chestnut St
- 201 Alpine Place
- 285 Riverside Dr
- 120 Alpine Place