Estimated Value: $848,177 - $1,031,000
3
Beds
2
Baths
1,951
Sq Ft
$477/Sq Ft
Est. Value
About This Home
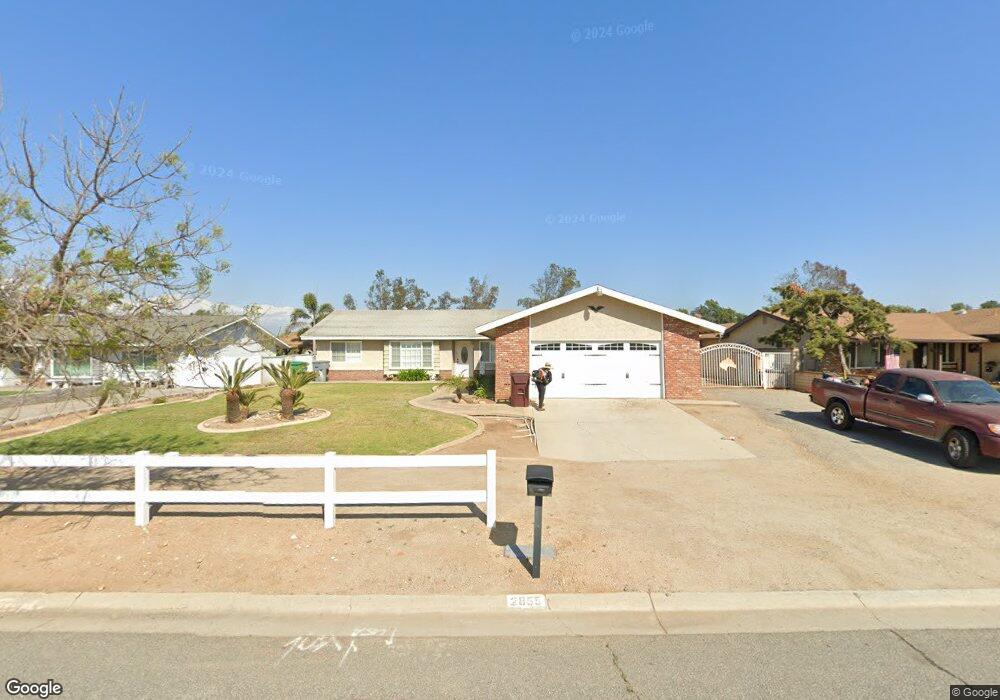
This home is located at 2855 Corydon Ave, Norco, CA 92860 and is currently estimated at $930,294, approximately $476 per square foot. 2855 Corydon Ave is a home located in Riverside County with nearby schools including Highland Elementary, Norco Intermediate School, and Norco High School.
Ownership History
Date
Name
Owned For
Owner Type
Purchase Details
Closed on
Jul 9, 2021
Sold by
Holston Wayne A and Holston Moana
Bought by
Holston Moana
Current Estimated Value
Home Financials for this Owner
Home Financials are based on the most recent Mortgage that was taken out on this home.
Original Mortgage
$203,000
Outstanding Balance
$155,316
Interest Rate
2.96%
Mortgage Type
New Conventional
Estimated Equity
$774,978
Purchase Details
Closed on
May 1, 1995
Sold by
Wells Fargo Bank Na
Bought by
Holston Wayne A and Holston Moana
Home Financials for this Owner
Home Financials are based on the most recent Mortgage that was taken out on this home.
Original Mortgage
$160,550
Interest Rate
8.32%
Purchase Details
Closed on
Feb 3, 1995
Sold by
Hawthorne Robert E and Hawthorne Cheryle A
Bought by
Wells Fargo Bank Na
Purchase Details
Closed on
Jun 10, 1994
Sold by
Mariner Sharon L
Bought by
Morales William A
Create a Home Valuation Report for This Property
The Home Valuation Report is an in-depth analysis detailing your home's value as well as a comparison with similar homes in the area
Home Values in the Area
Average Home Value in this Area
Purchase History
| Date | Buyer | Sale Price | Title Company |
|---|---|---|---|
| Holston Moana | -- | Ticor Title Company | |
| Holston Wayne A | $169,000 | Continental Title | |
| Wells Fargo Bank Na | $141,950 | North American Title Company | |
| Morales William A | -- | -- |
Source: Public Records
Mortgage History
| Date | Status | Borrower | Loan Amount |
|---|---|---|---|
| Open | Holston Moana | $203,000 | |
| Previous Owner | Holston Wayne A | $160,550 |
Source: Public Records
Tax History Compared to Growth
Tax History
| Year | Tax Paid | Tax Assessment Tax Assessment Total Assessment is a certain percentage of the fair market value that is determined by local assessors to be the total taxable value of land and additions on the property. | Land | Improvement |
|---|---|---|---|---|
| 2025 | $3,202 | $299,198 | $117,557 | $181,641 |
| 2023 | $3,202 | $287,582 | $112,993 | $174,589 |
| 2022 | $3,097 | $281,944 | $110,778 | $171,166 |
| 2021 | $3,033 | $276,416 | $108,606 | $167,810 |
| 2020 | $2,999 | $273,583 | $107,493 | $166,090 |
| 2019 | $2,928 | $268,220 | $105,386 | $162,834 |
| 2018 | $2,860 | $262,962 | $103,320 | $159,642 |
| 2017 | $2,787 | $257,807 | $101,295 | $156,512 |
| 2016 | $2,757 | $252,753 | $99,309 | $153,444 |
| 2015 | $2,695 | $248,958 | $97,818 | $151,140 |
| 2014 | $2,594 | $244,082 | $95,902 | $148,180 |
Source: Public Records
Map
Nearby Homes
- 2888 Corydon Ave
- 3153 Arapaho St
- 4047 Bluff St
- 2354 Corydon Ave
- 3344 Dales Dr
- 1966 Trotter Trail
- 1281 Carriage Ln
- 1196 Doverwood St
- 1268 Dale Cir
- 8330 Archibald Ave
- 8574 Lourenco Ln
- 4921 Bluff St
- 1233 Dale Cir
- 3711 Alhambra St
- 8312 Grapewin St
- 4931 Roundup Rd
- 1868 Kingsford Dr
- 0 6th & Corona Unit SW25164144
- 8224 Fieldstream Ct
- 0 Norco Dr
- 2845 Corydon Ave
- 2865 Corydon Ave
- 2835 Corydon Ave
- 2875 Corydon Ave
- 3488 Chestnut Dr
- 2885 Corydon Ave
- 2868 Corydon Ave
- 3498 Chestnut Dr
- 3493 Bluff St
- 3483 Bluff St
- 2895 Corydon Ave
- 2914 Broken Arrow St
- 2878 Corydon Ave
- 3495 Chestnut Dr
- 3473 Bluff St
- 3508 Chestnut Dr
- 3501 Bluff St
- 3463 Bluff St
- 2905 Corydon Ave
- 3505 Chestnut Dr