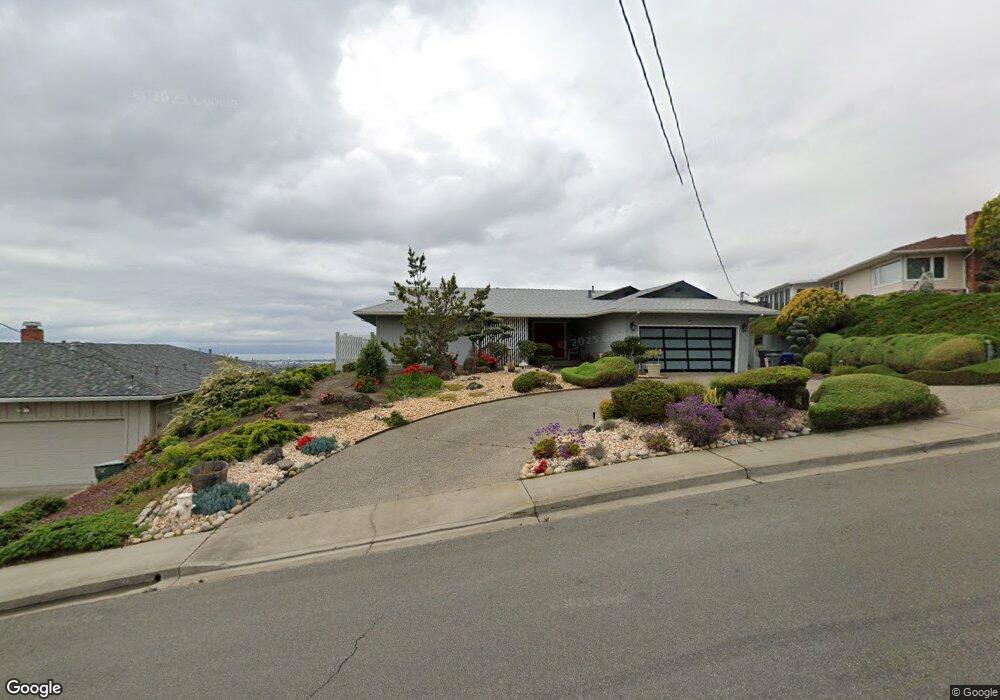
2859 Marineview Dr San Leandro, CA 94577
Bay-O-Vista NeighborhoodEstimated Value: $1,225,000 - $1,393,000
3
Beds
2
Baths
2,471
Sq Ft
$535/Sq Ft
Est. Value
About This Home
This home is located at 2859 Marineview Dr, San Leandro, CA 94577 and is currently estimated at $1,321,259, approximately $534 per square foot. 2859 Marineview Dr is a home located in Alameda County with nearby schools including Roosevelt Elementary School, Bancroft Middle School, and San Leandro High School.
Ownership History
Date
Name
Owned For
Owner Type
Purchase Details
Closed on
Jul 29, 2020
Sold by
Taylor Martha B
Bought by
Benton Martha and Martha Benton Clayton Taylor 2
Current Estimated Value
Purchase Details
Closed on
Aug 7, 2017
Sold by
Jesus Lynn and Roberts Revocable Living Trust
Bought by
Taylor Martha B
Home Financials for this Owner
Home Financials are based on the most recent Mortgage that was taken out on this home.
Original Mortgage
$630,000
Outstanding Balance
$524,548
Interest Rate
3.88%
Mortgage Type
New Conventional
Estimated Equity
$796,711
Purchase Details
Closed on
Apr 9, 2017
Sold by
Roberts Roberts Anthony P Anthony P and Roberts Anthony P
Bought by
Roberts Anthony P and Roberts Revocable Living Trust
Purchase Details
Closed on
Aug 14, 2006
Sold by
Roberts Anthony Paul and Roberts Dorothy Rae
Bought by
Roberts Anthony P and Roberts Dorothy Rae
Create a Home Valuation Report for This Property
The Home Valuation Report is an in-depth analysis detailing your home's value as well as a comparison with similar homes in the area
Home Values in the Area
Average Home Value in this Area
Purchase History
| Date | Buyer | Sale Price | Title Company |
|---|---|---|---|
| Benton Martha | -- | None Available | |
| Taylor Martha B | $907,500 | North American Title Co Inc | |
| Roberts Anthony P | -- | None Available | |
| Roberts Anthony P | -- | None Available |
Source: Public Records
Mortgage History
| Date | Status | Borrower | Loan Amount |
|---|---|---|---|
| Open | Taylor Martha B | $630,000 |
Source: Public Records
Tax History Compared to Growth
Tax History
| Year | Tax Paid | Tax Assessment Tax Assessment Total Assessment is a certain percentage of the fair market value that is determined by local assessors to be the total taxable value of land and additions on the property. | Land | Improvement |
|---|---|---|---|---|
| 2025 | $2,780 | $153,566 | $45,050 | $115,516 |
| 2024 | $2,780 | $150,418 | $44,167 | $113,251 |
| 2023 | $2,713 | $154,332 | $43,301 | $111,031 |
| 2022 | $2,638 | $144,306 | $42,452 | $108,854 |
| 2021 | $2,523 | $141,340 | $41,620 | $106,720 |
| 2020 | $2,429 | $146,819 | $41,193 | $105,626 |
| 2019 | $2,365 | $143,942 | $40,386 | $103,556 |
| 2018 | $11,486 | $907,200 | $272,000 | $635,200 |
| 2017 | $2,611 | $167,315 | $65,278 | $102,037 |
| 2016 | $2,484 | $164,035 | $63,998 | $100,037 |
| 2015 | $2,440 | $161,571 | $63,037 | $98,534 |
| 2014 | $2,415 | $158,406 | $61,802 | $96,604 |
Source: Public Records
Map
Nearby Homes
- 2290 Upland Rd
- 14683 Midland Rd
- 1293 Vistagrand Dr
- 2724 Benedict Dr
- 1939 Placer Dr
- 2230 Sol St
- 0 Saturn Dr
- 2132 Longview Dr
- 2153 Lakeview Dr
- 14972 Lark St
- 14955 Lark St
- 14625 Bancroft Ave
- 1876 Benedict Dr
- 14850 Donna St
- 14101 E 14th St Unit 306
- 15683 Liberty St
- 1468 Grand Ave Unit 9
- 1468 Grand Ave Unit 39
- 1468 Grand Ave Unit 21
- 1253 139th Ave
- 2873 Marineview Dr
- 2837 Marineview Dr
- 2881 Marineview Dr
- 2819 Marineview Dr
- 2844 Marineview Dr
- 1750 Vistagrand Dr
- 2876 Marineview Dr
- 1650 Vistagrand Dr
- 1673 Vistagrand Dr
- 1689 Vistagrand Dr
- 1657 Vistagrand Dr
- 2808 Marineview Dr
- 2895 Marineview Dr
- 1705 Vistagrand Dr
- 2797 Lakeview Dr
- 2882 Marineview Dr
- 2789 Lakeview Dr
- 1644 Vistagrand Dr
- 2790 Marineview Dr
- 1645 Vistagrand Dr