286 Hillsdale Dr Woodland, WA 98674
Estimated Value: $732,000 - $931,000
4
Beds
3
Baths
3,869
Sq Ft
$213/Sq Ft
Est. Value
About This Home
This home is located at 286 Hillsdale Dr, Woodland, WA 98674 and is currently estimated at $825,819, approximately $213 per square foot. 286 Hillsdale Dr is a home located in Cowlitz County with nearby schools including Woodland High School.
Ownership History
Date
Name
Owned For
Owner Type
Purchase Details
Closed on
Mar 25, 2010
Sold by
S-Cap 09-5080 Llc
Bought by
Travers Mark and Travers Ann
Current Estimated Value
Home Financials for this Owner
Home Financials are based on the most recent Mortgage that was taken out on this home.
Original Mortgage
$320,100
Outstanding Balance
$210,896
Interest Rate
4.94%
Mortgage Type
Purchase Money Mortgage
Estimated Equity
$614,923
Purchase Details
Closed on
Dec 29, 2009
Sold by
West Coast Bank
Bought by
S-Cap 09-5808 Llc
Purchase Details
Closed on
Sep 23, 2008
Sold by
Nation Liv A and Nation Terry M
Bought by
West Coast Bank
Purchase Details
Closed on
Jul 26, 2006
Sold by
East Bank Llc
Bought by
Nation Terry M and Nation Liv A
Home Financials for this Owner
Home Financials are based on the most recent Mortgage that was taken out on this home.
Original Mortgage
$523,000
Interest Rate
6.57%
Mortgage Type
Balloon
Create a Home Valuation Report for This Property
The Home Valuation Report is an in-depth analysis detailing your home's value as well as a comparison with similar homes in the area
Home Values in the Area
Average Home Value in this Area
Purchase History
| Date | Buyer | Sale Price | Title Company |
|---|---|---|---|
| Travers Mark | $336,000 | Cowlitz Title | |
| S-Cap 09-5808 Llc | $230,750 | Cowlitz Title | |
| West Coast Bank | $396,300 | None Available | |
| Nation Terry M | $169,900 | Chicago Title Ins |
Source: Public Records
Mortgage History
| Date | Status | Borrower | Loan Amount |
|---|---|---|---|
| Open | Travers Mark | $320,100 | |
| Previous Owner | Nation Terry M | $523,000 |
Source: Public Records
Tax History Compared to Growth
Tax History
| Year | Tax Paid | Tax Assessment Tax Assessment Total Assessment is a certain percentage of the fair market value that is determined by local assessors to be the total taxable value of land and additions on the property. | Land | Improvement |
|---|---|---|---|---|
| 2024 | $5,991 | $649,210 | $110,210 | $539,000 |
| 2023 | $4,889 | $691,430 | $99,280 | $592,150 |
| 2022 | $6,132 | $735,930 | $99,280 | $636,650 |
| 2021 | $6,365 | $572,950 | $85,590 | $487,360 |
| 2020 | $5,584 | $567,120 | $86,490 | $480,630 |
| 2019 | $4,954 | $487,854 | $83,966 | $403,888 |
| 2018 | $5,656 | $457,940 | $83,970 | $373,970 |
| 2017 | $4,491 | $453,940 | $79,970 | $373,970 |
| 2016 | $4,170 | $393,310 | $71,400 | $321,910 |
| 2015 | $4,893 | $366,630 | $70,000 | $296,630 |
| 2013 | -- | $351,430 | $61,290 | $290,140 |
Source: Public Records
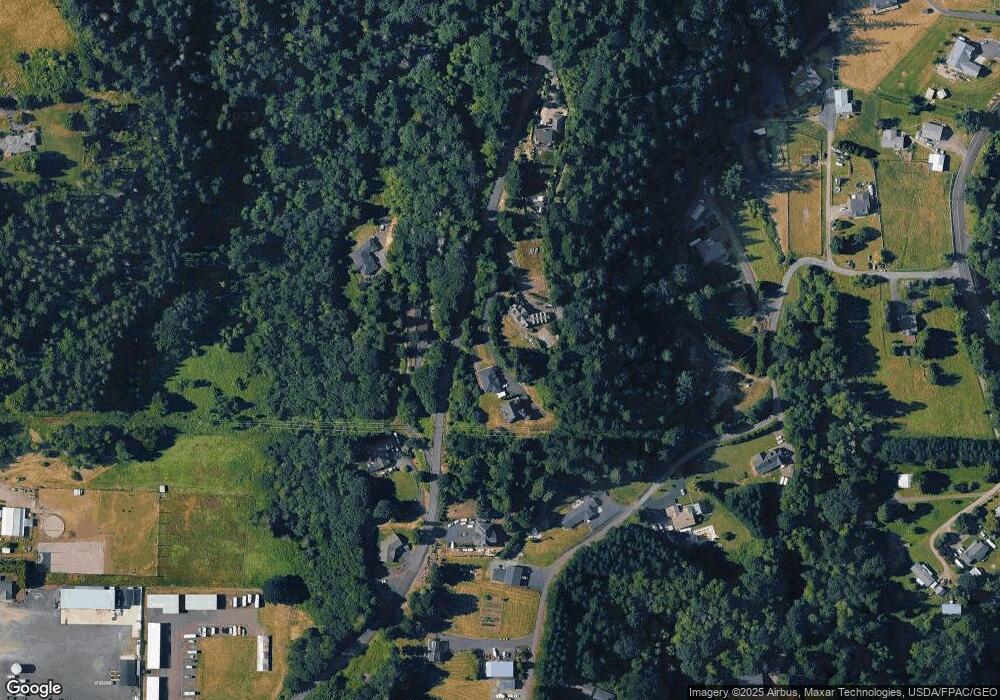
Map
Nearby Homes
- 605 Gun Club Rd
- 4130 Green Mountain Rd
- 369 Gun Club Rd Unit 48
- 369 Gun Club Rd Unit 101
- 369 Gun Club Rd Unit 70
- 369 Gun Club Rd Unit 53
- 369 Gun Club Rd Unit 117
- 369 Gun Club Rd Unit 114
- 336 York St
- 1334 Insel Rd
- 1786 Clatsop St
- 1776 Clover Ln
- 2216 Statesman Dr Unit Lot 46
- 2210 Statesman Dr Unit 44
- 1850 Heartwood Dr
- 284 Gun Club Rd
- 2271 Ash St Unit Lot 92
- 1833 Hawthorne Ct
- 2233 Ash St Unit Lot 84
- 2229 Ash St Unit Lot 83
- 351 Hillsdale Dr
- 431 Hillsdale Dr
- 0 XXX Hillsdale Dr
- 293 Hillsdale Dr
- 254 Hillsdale Dr
- 265 Hillsdale Dr
- 251 Hillsdale Dr
- 290 Hillsdale Dr
- 271 Hillsdale Dr
- 294 Hillsdale Dr
- 124 Bozarth Heights Rd
- 143 Bozarth Heights Rd
- 168 Bozarth Heights Rd
- 303 Hillsdale Dr
- 171 Bozarth Heights Rd
- 677 Insel Rd
- 195 Bozarth Heights Rd