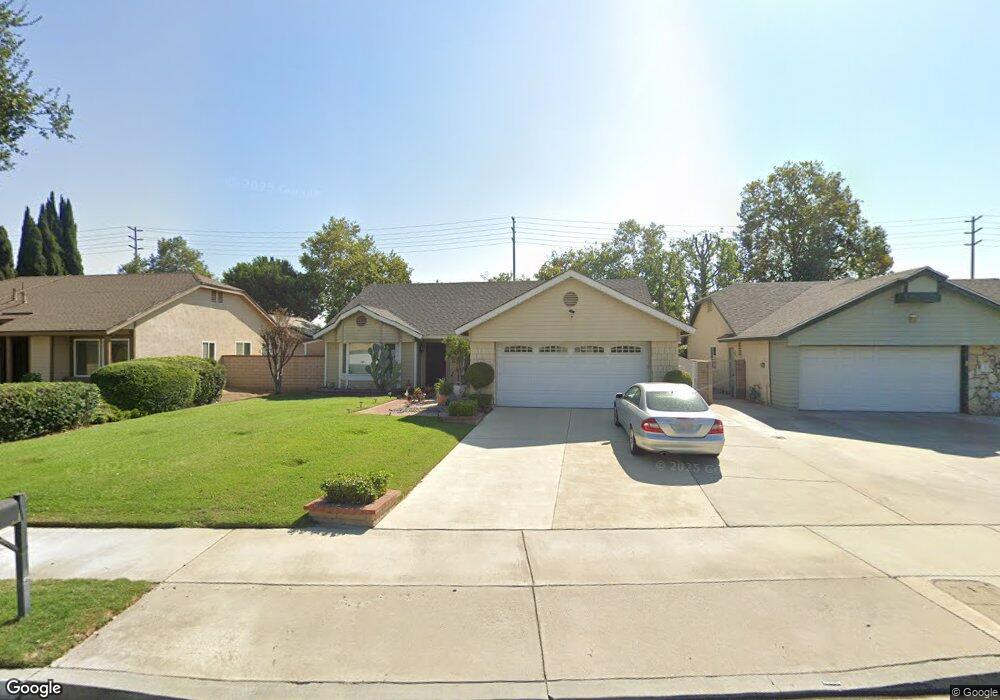
2861 S Parkside Dr Ontario, CA 91761
Ontario Ranch NeighborhoodEstimated Value: $717,477 - $840,000
3
Beds
2
Baths
1,818
Sq Ft
$431/Sq Ft
Est. Value
About This Home
This home is located at 2861 S Parkside Dr, Ontario, CA 91761 and is currently estimated at $783,119, approximately $430 per square foot. 2861 S Parkside Dr is a home located in San Bernardino County with nearby schools including Liberty Elementary School, Woodcrest Junior High, and Chino High School.
Ownership History
Date
Name
Owned For
Owner Type
Purchase Details
Closed on
Jul 22, 2019
Sold by
Jackson Peggy L
Bought by
Jackson Peggy L and The Jackson Living Trust
Current Estimated Value
Purchase Details
Closed on
Nov 1, 2018
Sold by
Jackson Peggy L
Bought by
Jackson Peggy L
Home Financials for this Owner
Home Financials are based on the most recent Mortgage that was taken out on this home.
Original Mortgage
$316,442
Outstanding Balance
$275,044
Interest Rate
4.25%
Mortgage Type
FHA
Estimated Equity
$508,075
Purchase Details
Closed on
Sep 17, 2007
Sold by
Jackson Pegg Lee
Bought by
Jackson Peggy and Peggy Jackson Living Trust
Purchase Details
Closed on
Apr 1, 2002
Sold by
Rodney Jackson Peggy Lee
Bought by
Jackson Peggy Lee
Home Financials for this Owner
Home Financials are based on the most recent Mortgage that was taken out on this home.
Original Mortgage
$173,000
Interest Rate
7.08%
Purchase Details
Closed on
Jan 20, 1997
Sold by
Mulvey Brian E and Mulvey Lucretia T
Bought by
Jackson Peggy Lee
Home Financials for this Owner
Home Financials are based on the most recent Mortgage that was taken out on this home.
Original Mortgage
$142,500
Interest Rate
6.25%
Create a Home Valuation Report for This Property
The Home Valuation Report is an in-depth analysis detailing your home's value as well as a comparison with similar homes in the area
Home Values in the Area
Average Home Value in this Area
Purchase History
| Date | Buyer | Sale Price | Title Company |
|---|---|---|---|
| Jackson Peggy L | -- | None Available | |
| Jackson Peggy L | -- | Pacific Coast Title Company | |
| Jackson Peggy | -- | None Available | |
| Jackson Peggy Lee | -- | New Century Title Company | |
| Jackson Peggy Lee | $150,000 | First American Title Ins Co |
Source: Public Records
Mortgage History
| Date | Status | Borrower | Loan Amount |
|---|---|---|---|
| Open | Jackson Peggy L | $316,442 | |
| Closed | Jackson Peggy Lee | $173,000 | |
| Closed | Jackson Peggy Lee | $142,500 |
Source: Public Records
Tax History Compared to Growth
Tax History
| Year | Tax Paid | Tax Assessment Tax Assessment Total Assessment is a certain percentage of the fair market value that is determined by local assessors to be the total taxable value of land and additions on the property. | Land | Improvement |
|---|---|---|---|---|
| 2025 | $2,631 | $244,302 | $65,148 | $179,154 |
| 2024 | $2,631 | $239,512 | $63,871 | $175,641 |
| 2023 | $2,559 | $234,816 | $62,619 | $172,197 |
| 2022 | $2,542 | $230,212 | $61,391 | $168,821 |
| 2021 | $2,492 | $225,698 | $60,187 | $165,511 |
| 2020 | $2,460 | $223,384 | $59,570 | $163,814 |
| 2019 | $2,416 | $219,004 | $58,402 | $160,602 |
| 2018 | $2,363 | $214,710 | $57,257 | $157,453 |
| 2017 | $2,320 | $210,500 | $56,134 | $154,366 |
| 2016 | $2,170 | $206,372 | $55,033 | $151,339 |
| 2015 | $2,127 | $203,272 | $54,206 | $149,066 |
| 2014 | $2,084 | $199,290 | $53,144 | $146,146 |
Source: Public Records
Map
Nearby Homes
- 1020 E Tam o Shanter Ct
- 2718 S Sandpiper Ave
- 2817 S Lassen Ave
- 2453 S Marigold Place
- 2919 S Caldwell Ave
- 2535 S Imperial Place
- 2437 S Garfield Place
- 2424 S Lake Ave
- 4235 S Gasly Paseo
- 0 Vineyard Unit CV25067044
- 4245 S Grasly Paseo
- 4233 S Grasly Paseo
- 0 Phillips Unit CV23180894
- 1557 E Cherry Hill St
- 2408 S Taylor Place
- 2620 S Quaker Ridge Place
- 1456 E Philadelphia St Unit 134
- 1456 E Philadelphia St Unit 378
- 1456 E Philadelphia St
- 1456 E Philadelphia St Unit 279
- 2855 S Parkside Dr
- 2901 Parkside Ave
- 2851 S Parkside Dr
- 2911 Parkside Ave
- 1187 E Merion St
- 2862 S Parkside Dr
- 2847 S Parkside Dr
- 2917 Parkside Ave
- 2856 S Parkside Dr
- 2860 S Amador Ave
- 2854 S Amador Ave
- 2852 S Parkside Dr
- 2902 S Amador Ave
- 1181 E Merion St
- 2850 S Amador Ave
- 2841 S Parkside Dr
- 2910 S Amador Ave
- 2848 S Parkside Dr
- 2923 Parkside Ave
- 2846 S Amador Ave