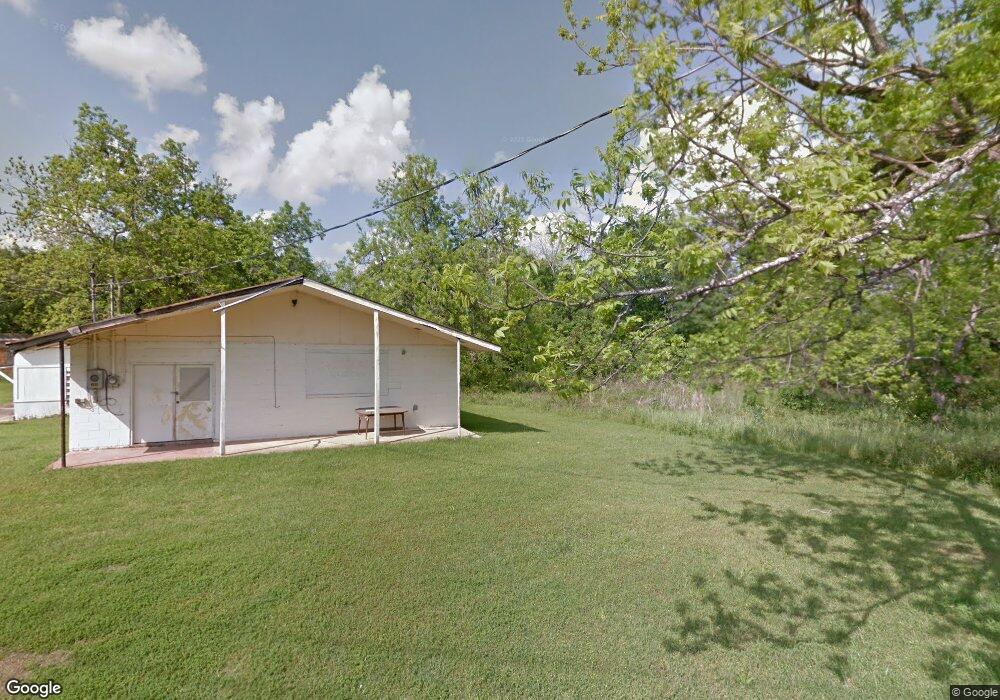
288 Hurst St NW Pelham, GA 31779
Estimated Value: $216,038 - $260,000
--
Bed
--
Bath
3,112
Sq Ft
$77/Sq Ft
Est. Value
About This Home
This home is located at 288 Hurst St NW, Pelham, GA 31779 and is currently estimated at $240,760, approximately $77 per square foot. 288 Hurst St NW is a home with nearby schools including Pelham Elementary School, Pelham City Middle School, and Pelham High School.
Ownership History
Date
Name
Owned For
Owner Type
Purchase Details
Closed on
Jul 11, 2023
Sold by
Mitchell County Community Family Affairs
Bought by
Rhymes Janissa
Current Estimated Value
Home Financials for this Owner
Home Financials are based on the most recent Mortgage that was taken out on this home.
Original Mortgage
$211,105
Outstanding Balance
$206,032
Interest Rate
6.75%
Mortgage Type
FHA
Estimated Equity
$34,728
Purchase Details
Closed on
Dec 29, 2017
Sold by
Thomas Nathaniel
Bought by
Mitchell County Family Affairs
Purchase Details
Closed on
Aug 31, 2015
Sold by
Randall James
Bought by
Thomas Nathaniel
Purchase Details
Closed on
Apr 16, 2014
Sold by
The Crossroads Bible Minis
Bought by
Synthia Randall and Randall James E
Purchase Details
Closed on
Mar 28, 2011
Sold by
Randall James and Randall Synthia
Bought by
The Crossroads Bible Ministry Inc
Purchase Details
Closed on
Jun 29, 2006
Sold by
Thomas Nathaniel
Bought by
Randall James E and Randall Synthia
Create a Home Valuation Report for This Property
The Home Valuation Report is an in-depth analysis detailing your home's value as well as a comparison with similar homes in the area
Home Values in the Area
Average Home Value in this Area
Purchase History
| Date | Buyer | Sale Price | Title Company |
|---|---|---|---|
| Rhymes Janissa | $215,000 | -- | |
| Mitchell County Family Affairs | -- | -- | |
| Thomas Nathaniel | -- | -- | |
| Synthia Randall | -- | -- | |
| The Crossroads Bible Ministry Inc | -- | -- | |
| Randall James E | $45,000 | -- |
Source: Public Records
Mortgage History
| Date | Status | Borrower | Loan Amount |
|---|---|---|---|
| Open | Rhymes Janissa | $211,105 |
Source: Public Records
Tax History Compared to Growth
Tax History
| Year | Tax Paid | Tax Assessment Tax Assessment Total Assessment is a certain percentage of the fair market value that is determined by local assessors to be the total taxable value of land and additions on the property. | Land | Improvement |
|---|---|---|---|---|
| 2024 | $3,231 | $75,240 | $3,960 | $71,280 |
| 2023 | $328 | $38,240 | $3,960 | $34,280 |
| 2022 | $328 | $7,400 | $3,960 | $3,440 |
| 2021 | $335 | $7,400 | $3,960 | $3,440 |
| 2020 | $335 | $7,400 | $3,960 | $3,440 |
| 2019 | $322 | $7,400 | $3,960 | $3,440 |
| 2018 | $804 | $17,790 | $4,000 | $13,790 |
| 2017 | $350 | $17,790 | $4,000 | $13,790 |
| 2016 | $364 | $17,790 | $4,000 | $13,790 |
| 2015 | $364 | $17,790 | $4,000 | $13,790 |
| 2014 | $364 | $17,790 | $4,000 | $13,790 |
| 2013 | $364 | $17,790 | $3,999 | $13,790 |
Source: Public Records
Map
Nearby Homes
- 233 Cannon St NW
- 210 Castleberry St NW
- 212 Hand Ave W
- 354 Bennett St NW
- 199 Carroll St NE
- 209 McDonald St SW
- 323 Curry St NE
- 335 Curry St NE
- 135 Baggs Ave SE
- 183 Baggs Ave SE
- 589 Liberia St NW
- 254 Sapp Ave SW
- 438 Dogwood Dr NE
- 277 Saunders St SW
- 653 Liberia St NW
- 482 Curry St NE
- 3** Youngs Mill Rd
- 375 Baggs Ave SE
- 547 Cotton Rd NE
- 389 Stewart St SW
- 286 Church St NW
- 290 Church St NW
- 291 Church St
- 299 Church St NW
- 312 Church St NW
- 116 Church St NW
- 300 Love St NW
- 125 Acres Hurst Tate Rd
- 199 Cooper St NW
- 318 Church St NW
- 0 Cooper St NW Unit 8349412
- 0 Cooper St NW Unit 8149004
- 312 Love St NW
- 209 Cooper St NW
- 326 Church St NW
- 319 Church St NW
- 233 Church St SW
- 214 Ella St NW
- 255 School St NW
- 322 Love St NW