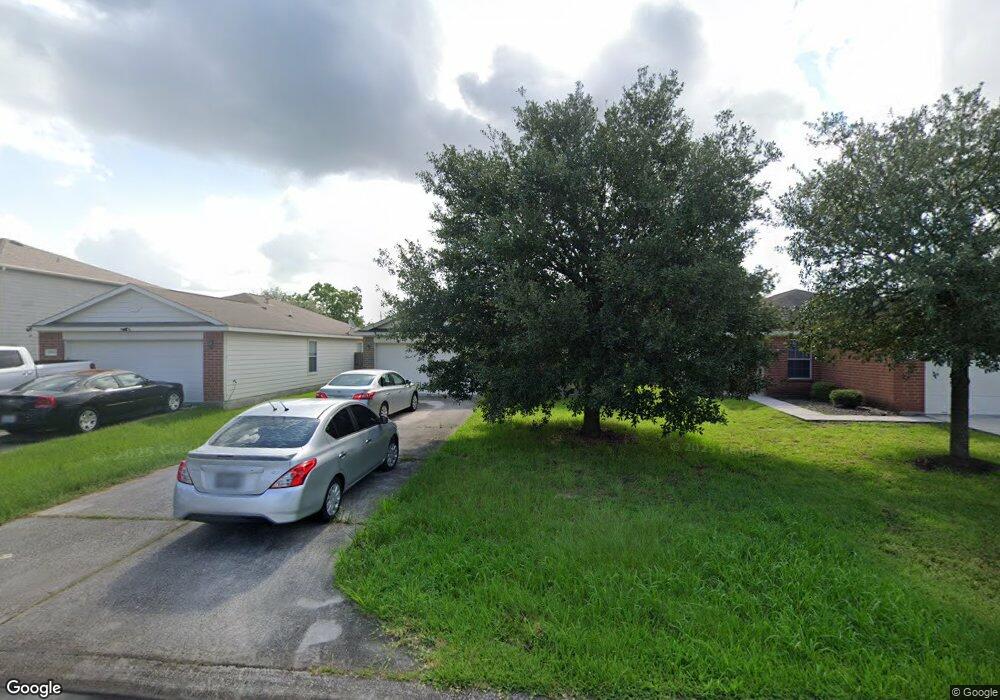
28930 Village Creek Loop Spring, TX 77386
Estimated Value: $232,174 - $255,000
3
Beds
2
Baths
1,410
Sq Ft
$174/Sq Ft
Est. Value
About This Home
This home is located at 28930 Village Creek Loop, Spring, TX 77386 and is currently estimated at $245,294, approximately $173 per square foot. 28930 Village Creek Loop is a home located in Montgomery County with nearby schools including Bradley Elementary School, York J High School, and Grand Oaks High School.
Ownership History
Date
Name
Owned For
Owner Type
Purchase Details
Closed on
Apr 18, 2018
Sold by
Tall 2015 1 Borrower Llc
Bought by
Tah 2018 1 Borrower Llc
Current Estimated Value
Purchase Details
Closed on
May 12, 2015
Sold by
Tah Holding Lp
Bought by
Tah 2015 1 Borrower Llc
Purchase Details
Closed on
Oct 13, 2014
Sold by
Churchill Albert B
Bought by
Tah Holding Lp
Purchase Details
Closed on
Aug 11, 2014
Sold by
Jpmorgan Chase Bank Na
Bought by
Churchill Albert B
Purchase Details
Closed on
Jul 1, 2014
Sold by
Allen Ryan A and Allen Tiffany K
Bought by
Jpmorgan Chase Bank Na
Purchase Details
Closed on
Jun 27, 2008
Sold by
Lgi Homes Ltd
Bought by
Allen Ryan A and Allen Tiffany K
Home Financials for this Owner
Home Financials are based on the most recent Mortgage that was taken out on this home.
Original Mortgage
$123,170
Interest Rate
6.11%
Mortgage Type
Purchase Money Mortgage
Create a Home Valuation Report for This Property
The Home Valuation Report is an in-depth analysis detailing your home's value as well as a comparison with similar homes in the area
Home Values in the Area
Average Home Value in this Area
Purchase History
| Date | Buyer | Sale Price | Title Company |
|---|---|---|---|
| Tah 2018 1 Borrower Llc | -- | None Available | |
| Tah 2015 1 Borrower Llc | -- | None Available | |
| Tah Holding Lp | -- | Fidelity National Title | |
| Churchill Albert B | -- | None Available | |
| Jpmorgan Chase Bank Na | -- | None Available | |
| Allen Ryan A | -- | American Title Company |
Source: Public Records
Mortgage History
| Date | Status | Borrower | Loan Amount |
|---|---|---|---|
| Previous Owner | Allen Ryan A | $123,170 |
Source: Public Records
Tax History Compared to Growth
Tax History
| Year | Tax Paid | Tax Assessment Tax Assessment Total Assessment is a certain percentage of the fair market value that is determined by local assessors to be the total taxable value of land and additions on the property. | Land | Improvement |
|---|---|---|---|---|
| 2025 | $3,712 | $223,474 | $29,767 | $193,707 |
| 2024 | $3,858 | $235,000 | $29,767 | $205,233 |
| 2023 | $3,858 | $244,850 | $29,770 | $215,080 |
| 2022 | $3,779 | $217,770 | $29,770 | $188,000 |
| 2021 | $3,112 | $168,320 | $29,770 | $138,550 |
| 2020 | $3,114 | $160,180 | $29,770 | $130,410 |
| 2019 | $3,134 | $155,590 | $29,770 | $125,820 |
| 2018 | $2,890 | $143,470 | $29,770 | $113,700 |
| 2017 | $2,886 | $143,470 | $29,770 | $113,700 |
| 2016 | $2,661 | $132,290 | $29,770 | $102,520 |
| 2015 | $2,190 | $130,620 | $29,770 | $100,850 |
| 2014 | $2,190 | $107,780 | $29,770 | $78,010 |
Source: Public Records
Map
Nearby Homes
- 4630 Canadian River Ct
- 28719 Leon River Ct
- 3919 Dorothy Oaks Ct
- 4926 Comal River Loop
- 4822 San Antonio River Dr
- 28961 San Bernard River Loop
- 29515 Crimson Beech Dr
- 3864 Oakmist Bend Ln
- 29516 Samara Dr
- 28894 Llano River Loop
- 4710 Comal River Loop
- 31268 New Forest Park Ln
- 3841 Enchanted Timbers Ln
- 3791 Lake Bend Shore Dr
- 29522 Westhope Dr
- 31201 Redwood Manor Ct
- 29887 Woodsons Edge Way
- 29871 Woodsons Edge Way
- 29583 Usonia Dr
- 29627 Yaupon Shore Dr
- 28934 Village Creek Loop
- 28926 Village Creek Loop
- 28922 Village Creek Loop
- 28938 Village Creek Loop
- 29019 E Pecos River Ct
- 29015 E Pecos River Ct
- 29011 E Pecos River Ct
- 28918 Village Creek Loop
- 29023 E Pecos River Ct
- 28918 Village Creek Loop
- 29007 E Pecos River Ct
- 28923 Village Creek Loop
- 28942 Village Creek Loop
- 28927 Village Creek Loop
- 29003 E Pecos River Ct
- 28919 Village Creek Loop
- 28946 Village Creek Loop
- 29027 E Pecos River Ct
- 28927 E Pecos River Ct
- 28914 Village Creek Loop