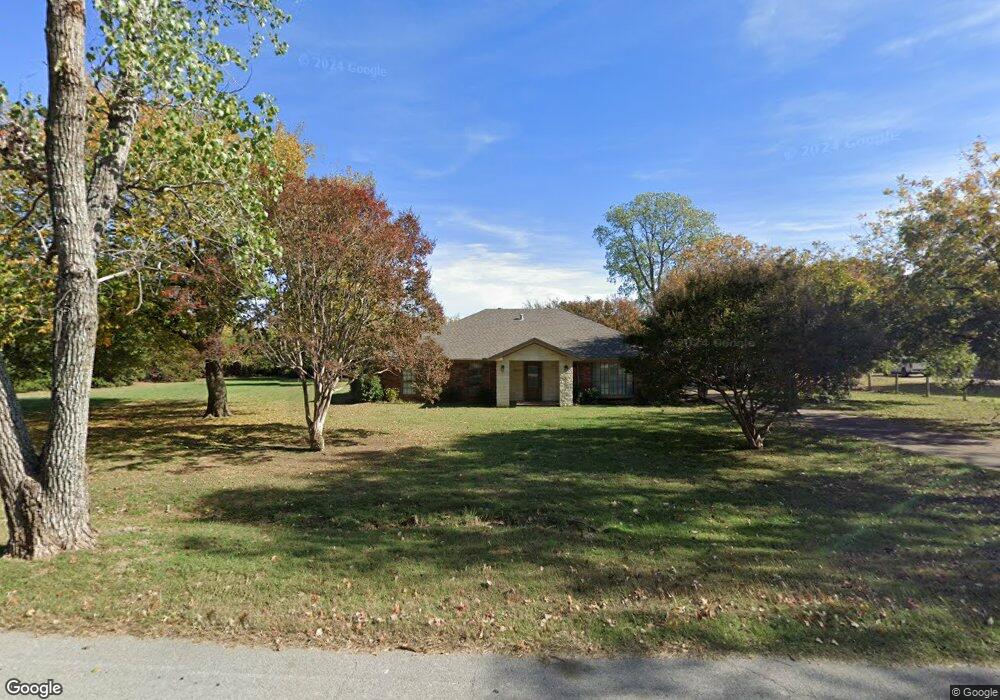
2895 Burney Ln Southlake, TX 76092
Estimated Value: $942,000 - $1,243,000
3
Beds
3
Baths
2,240
Sq Ft
$503/Sq Ft
Est. Value
About This Home
This home is located at 2895 Burney Ln, Southlake, TX 76092 and is currently estimated at $1,126,868, approximately $503 per square foot. 2895 Burney Ln is a home located in Tarrant County with nearby schools including Jack D. Johnson Elementary, Don T. Durham Intermediate School, and Carroll Middle School.
Ownership History
Date
Name
Owned For
Owner Type
Purchase Details
Closed on
Sep 6, 2005
Sold by
Zimmerman Clark A and Zimmerman Jackie T
Bought by
Schroen Hans H and Schroen Alethea
Current Estimated Value
Home Financials for this Owner
Home Financials are based on the most recent Mortgage that was taken out on this home.
Original Mortgage
$200,000
Outstanding Balance
$106,529
Interest Rate
5.78%
Mortgage Type
Fannie Mae Freddie Mac
Estimated Equity
$1,020,339
Purchase Details
Closed on
May 11, 1998
Sold by
Wiseman Robert Gene and Wiseman Carol Ann
Bought by
Zimmermann Clark A and Zimmermann Jackie T
Home Financials for this Owner
Home Financials are based on the most recent Mortgage that was taken out on this home.
Original Mortgage
$149,600
Interest Rate
7.11%
Create a Home Valuation Report for This Property
The Home Valuation Report is an in-depth analysis detailing your home's value as well as a comparison with similar homes in the area
Home Values in the Area
Average Home Value in this Area
Purchase History
| Date | Buyer | Sale Price | Title Company |
|---|---|---|---|
| Schroen Hans H | -- | -- | |
| Zimmermann Clark A | -- | American Title Co |
Source: Public Records
Mortgage History
| Date | Status | Borrower | Loan Amount |
|---|---|---|---|
| Open | Schroen Hans H | $200,000 | |
| Previous Owner | Zimmermann Clark A | $149,600 | |
| Closed | Zimmermann Clark A | $18,700 |
Source: Public Records
Tax History Compared to Growth
Tax History
| Year | Tax Paid | Tax Assessment Tax Assessment Total Assessment is a certain percentage of the fair market value that is determined by local assessors to be the total taxable value of land and additions on the property. | Land | Improvement |
|---|---|---|---|---|
| 2025 | $9,153 | $926,000 | $636,000 | $290,000 |
| 2024 | $9,153 | $948,824 | $636,000 | $312,824 |
| 2023 | $10,391 | $1,072,903 | $636,000 | $436,903 |
| 2022 | $11,181 | $768,906 | $467,500 | $301,406 |
| 2021 | $10,742 | $730,596 | $467,500 | $263,096 |
| 2020 | $9,846 | $705,900 | $524,000 | $181,900 |
| 2019 | $9,429 | $713,856 | $524,000 | $189,856 |
| 2018 | $7,910 | $353,990 | $207,994 | $145,996 |
| 2017 | $7,976 | $529,989 | $324,000 | $205,989 |
| 2016 | $7,251 | $512,989 | $324,500 | $188,489 |
| 2015 | $5,731 | $296,000 | $137,000 | $159,000 |
| 2014 | $5,731 | $296,000 | $137,000 | $159,000 |
Source: Public Records
Map
Nearby Homes
- 2920 Burney Ln
- 1006 Quail Run Rd
- 1099 Burney Ln
- 1340 Burney Ln
- 3179 Southlake Park Rd
- 1018 Quail Run Rd
- 3333 Southlake Park Rd
- 3240 Woodland Dr
- 3321 Ferguson Rd
- 3325 Ferguson Rd
- 3316 Ferguson Rd
- 136 Sweet St
- 3501 N Gravel Cir
- 1013 Winfield Ct
- 3401 Witt Ct
- 3055 Midway Rd
- 3405 Witt Ct
- 3300 Jackson Ct
- 415 Marshall Rd
- 1497 E Dove Rd
- 2905 Burney Ln
- 2885 Burney Ln
- 2900 Harbor Refuge St
- 900 Harbor Ct
- 2900 Burney Ln
- 1064 Harbor Retreat St
- 2890 Harbor Refuge St
- 2915 Burney Ln
- 2910 Harbor Refuge St
- 895 Harbor Ct
- 2910 Burney Ln
- 890 Harbor Ct
- 2875 Burney Ln
- 2925 Burney Ln
- 885 Harbor Ct
- 2920 Harbor Refuge St
- 1029 Burney Ln
- 1095 Harbor Retreat St
- 2905 Harbor Refuge St
- 2925 Harbor Refuge St