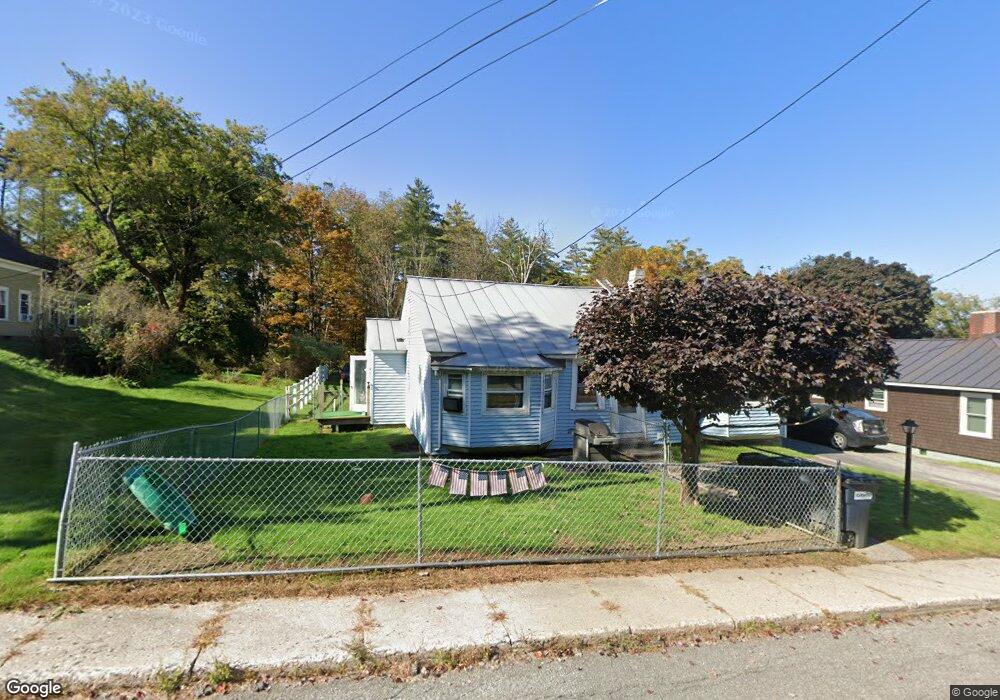
29 Chase St Claremont, NH 03743
East Side NeighborhoodEstimated Value: $245,000 - $308,000
3
Beds
1
Bath
1,224
Sq Ft
$227/Sq Ft
Est. Value
About This Home
This home is located at 29 Chase St, Claremont, NH 03743 and is currently estimated at $277,676, approximately $226 per square foot. 29 Chase St is a home located in Sullivan County with nearby schools including Maple Avenue School, Claremont Middle School, and Stevens High School.
Ownership History
Date
Name
Owned For
Owner Type
Purchase Details
Closed on
Jan 9, 2009
Sold by
Us Bank Na Tr
Bought by
Dupont Robert M and Stanley Rebecca S
Current Estimated Value
Home Financials for this Owner
Home Financials are based on the most recent Mortgage that was taken out on this home.
Original Mortgage
$104,387
Outstanding Balance
$68,782
Interest Rate
5.99%
Mortgage Type
Purchase Money Mortgage
Estimated Equity
$208,894
Purchase Details
Closed on
Aug 26, 2008
Sold by
Robitille Richard D
Bought by
Us Bank Na
Create a Home Valuation Report for This Property
The Home Valuation Report is an in-depth analysis detailing your home's value as well as a comparison with similar homes in the area
Home Values in the Area
Average Home Value in this Area
Purchase History
| Date | Buyer | Sale Price | Title Company |
|---|---|---|---|
| Dupont Robert M | $99,900 | -- | |
| Us Bank Na | $80,500 | -- |
Source: Public Records
Mortgage History
| Date | Status | Borrower | Loan Amount |
|---|---|---|---|
| Open | Us Bank Na | $104,387 |
Source: Public Records
Tax History Compared to Growth
Tax History
| Year | Tax Paid | Tax Assessment Tax Assessment Total Assessment is a certain percentage of the fair market value that is determined by local assessors to be the total taxable value of land and additions on the property. | Land | Improvement |
|---|---|---|---|---|
| 2024 | $5,916 | $202,200 | $38,700 | $163,500 |
| 2023 | $5,621 | $202,200 | $38,700 | $163,500 |
| 2022 | $4,714 | $113,100 | $17,800 | $95,300 |
| 2021 | $4,631 | $113,000 | $17,800 | $95,200 |
| 2020 | $4,601 | $113,000 | $17,800 | $95,200 |
| 2019 | $4,549 | $113,000 | $17,800 | $95,200 |
| 2018 | $3,690 | $87,700 | $17,800 | $69,900 |
| 2017 | $3,741 | $87,700 | $17,800 | $69,900 |
| 2016 | $3,738 | $87,700 | $17,800 | $69,900 |
| 2015 | $3,637 | $87,700 | $17,800 | $69,900 |
| 2014 | $3,625 | $87,700 | $17,800 | $69,900 |
| 2013 | $4,205 | $116,000 | $20,300 | $95,700 |
Source: Public Records
Map
Nearby Homes
- 45 Chase St
- 6 Osgood Ave
- 129 Chestnut St
- 22 Chestnut St
- 5 Nel Mar Heights
- 13 Green St
- 223 Chestnut St
- 20 Highland Ave
- 26 Myrtle St Unit 6
- 46 Ridge Ave
- 2 Birchwood Rd
- 278 Pleasant St
- 44 Walnut St
- 62 Ridge Ave
- 50 School St
- 22 Bible Hill Rd
- 38 Washington St
- 58 Pearl St
- 0 Off First St Unit 60
- 38 Goyette Ave