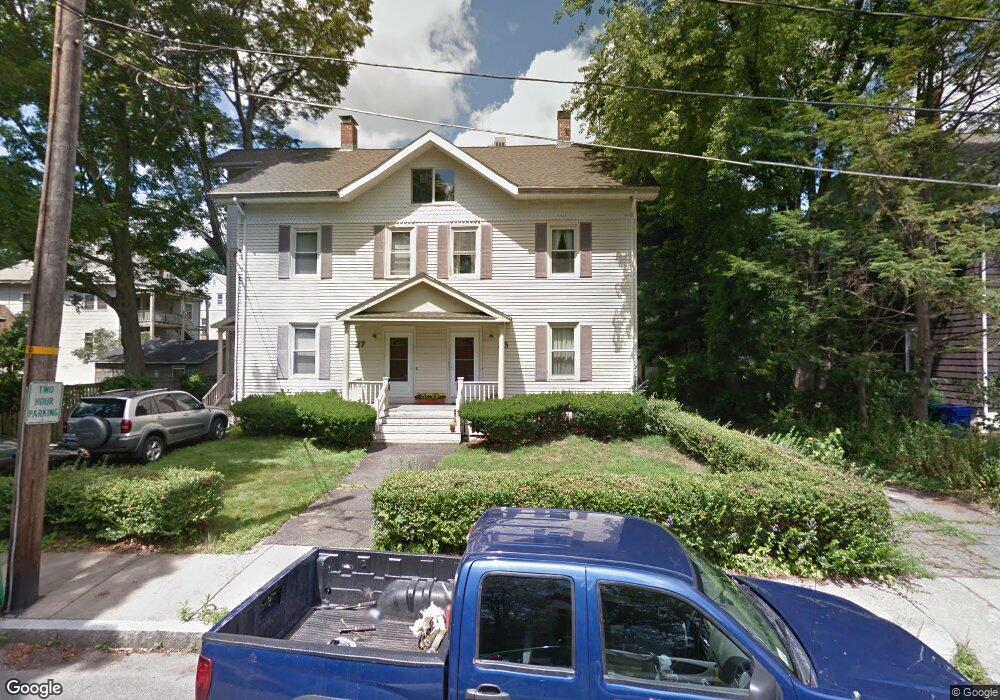
29 Maple Park Newton Center, MA 02459
Newton Centre NeighborhoodEstimated Value: $446,000
1
Bed
1
Bath
1,318
Sq Ft
$338/Sq Ft
Est. Value
About This Home
This home is located at 29 Maple Park, Newton Center, MA 02459 and is currently priced at $446,000, approximately $338 per square foot. 29 Maple Park is a home located in Middlesex County with nearby schools including Mason Rice Elementary School, Bowen School, and Oak Hill Middle School.
Ownership History
Date
Name
Owned For
Owner Type
Purchase Details
Closed on
Dec 14, 2021
Sold by
Oxenkrug Daniel
Bought by
Rachel Izrina Rt
Current Estimated Value
Purchase Details
Closed on
Sep 30, 2021
Sold by
Scolnick Vicky
Bought by
Izrina Rachel
Purchase Details
Closed on
Sep 5, 2002
Sold by
Chasse David J
Bought by
Scolnick Vicky
Home Financials for this Owner
Home Financials are based on the most recent Mortgage that was taken out on this home.
Original Mortgage
$232,000
Interest Rate
6.39%
Mortgage Type
Purchase Money Mortgage
Purchase Details
Closed on
May 30, 1996
Sold by
Raviv Adi
Bought by
Chasse David J
Home Financials for this Owner
Home Financials are based on the most recent Mortgage that was taken out on this home.
Original Mortgage
$152,000
Interest Rate
7.91%
Mortgage Type
Purchase Money Mortgage
Create a Home Valuation Report for This Property
The Home Valuation Report is an in-depth analysis detailing your home's value as well as a comparison with similar homes in the area
Home Values in the Area
Average Home Value in this Area
Purchase History
| Date | Buyer | Sale Price | Title Company |
|---|---|---|---|
| Rachel Izrina Rt | -- | None Available | |
| Oxenkrug Daniel | -- | None Available | |
| Izrina Rachel | $405,000 | None Available | |
| Scolnick Vicky | $290,000 | -- | |
| Chasse David J | $160,000 | -- | |
| Chasse David J | $160,000 | -- |
Source: Public Records
Mortgage History
| Date | Status | Borrower | Loan Amount |
|---|---|---|---|
| Previous Owner | Scolnick Vicky | $232,000 | |
| Previous Owner | Chasse David J | $152,500 | |
| Previous Owner | Chasse David J | $152,000 |
Source: Public Records
Tax History Compared to Growth
Tax History
| Year | Tax Paid | Tax Assessment Tax Assessment Total Assessment is a certain percentage of the fair market value that is determined by local assessors to be the total taxable value of land and additions on the property. | Land | Improvement |
|---|---|---|---|---|
| 2022 | $4,970 | $472,400 | $0 | $472,400 |
| 2021 | $4,796 | $445,700 | $0 | $445,700 |
| 2020 | $4,653 | $445,700 | $0 | $445,700 |
| 2019 | $4,522 | $432,700 | $0 | $432,700 |
| 2018 | $4,517 | $417,500 | $0 | $417,500 |
| 2017 | $4,380 | $393,900 | $0 | $393,900 |
| 2016 | $4,189 | $368,100 | $0 | $368,100 |
| 2015 | $4,070 | $350,600 | $0 | $350,600 |
Source: Public Records
Map
Nearby Homes
- 9 Ripley St Unit 1
- 154 Langley Rd Unit 1
- 145 Warren St Unit 4
- 20 Bartlett Terrace
- 42 Bow Rd
- 9 The Ledges Rd
- 20 Hamlet St
- 20 Hamlet St Unit 1
- 5 Halcyon Rd
- 42 Sunhill Ln
- 44 Irving St
- 625 Boylston St
- Lot 3 Chapin Rd
- Lot 2 Chapin Rd
- Lots 2 & 3 Chapin Rd
- 41-43 John Unit B
- 628 Boylston St
- 21 Francis St Unit 21A
- 250 Hammond Pond Pkwy Unit 1604N
- 250 Hammond Pond Pkwy Unit 1002N
- 25 Maple Park
- 25 Maple Park Unit 1
- 27 Maple Park
- 19 Maple Park Unit 21
- 42 Ripley St
- 44 Ripley St Unit 44
- 34 Ripley St Unit 36
- 28 Maple Park Unit 3
- 28 Maple Park Unit 2
- 30 Ripley St
- 30 Ripley St Unit 1
- 46 Ripley St
- 46 Ripley St Unit 46
- 26 Maple Park Unit 28
- 26 Maple Park Unit 3A
- 48 Ripley St
- 15 Maple Park
- 15 Maple Park Unit n/a
- 15 Maple Park
- 15 Maple Park Unit 1