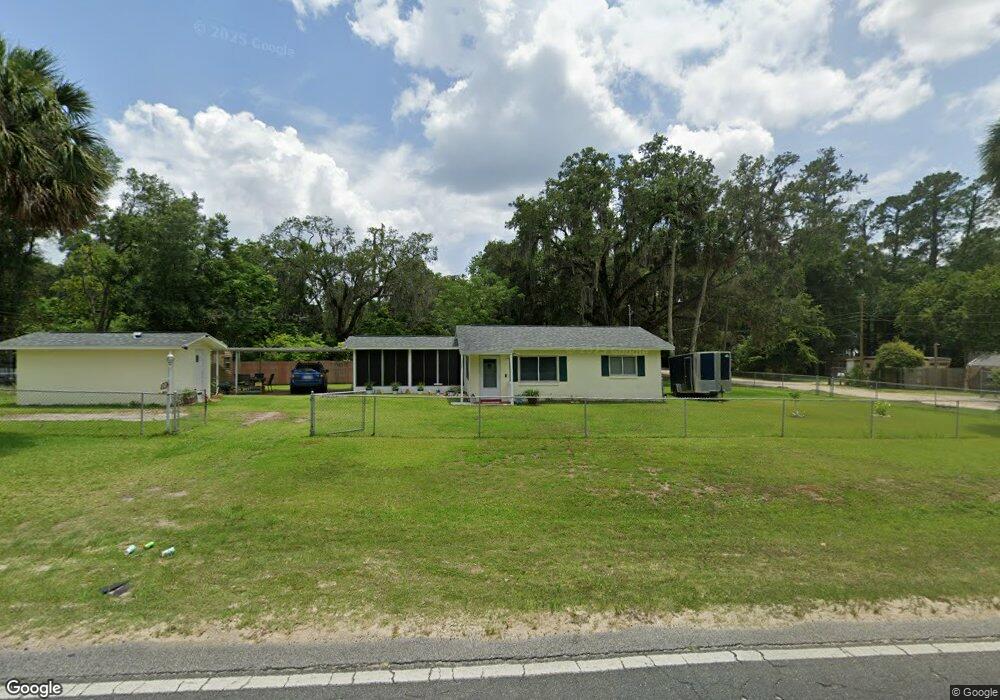
2900 SE 52nd St Ocala, FL 34480
Silver Spring Shores NeighborhoodEstimated Value: $115,000 - $184,000
2
Beds
1
Bath
780
Sq Ft
$192/Sq Ft
Est. Value
About This Home
This home is located at 2900 SE 52nd St, Ocala, FL 34480 and is currently estimated at $150,039, approximately $192 per square foot. 2900 SE 52nd St is a home located in Marion County with nearby schools including Shady Hill Elementary School, Belleview Middle School, and Forest High School.
Ownership History
Date
Name
Owned For
Owner Type
Purchase Details
Closed on
Feb 4, 2019
Sold by
Seabury James L and Seabury James L
Bought by
Seabury James L and Seabury Lora
Current Estimated Value
Purchase Details
Closed on
Jan 30, 2003
Sold by
Farley Diane A
Bought by
Seabury James L and Seabury James L
Home Financials for this Owner
Home Financials are based on the most recent Mortgage that was taken out on this home.
Original Mortgage
$38,570
Outstanding Balance
$16,519
Interest Rate
5.95%
Estimated Equity
$133,520
Create a Home Valuation Report for This Property
The Home Valuation Report is an in-depth analysis detailing your home's value as well as a comparison with similar homes in the area
Home Values in the Area
Average Home Value in this Area
Purchase History
| Date | Buyer | Sale Price | Title Company |
|---|---|---|---|
| Seabury James L | -- | Attorney | |
| Seabury James L | $40,600 | Ocala Land Title Ins Agency |
Source: Public Records
Mortgage History
| Date | Status | Borrower | Loan Amount |
|---|---|---|---|
| Open | Seabury James L | $38,570 |
Source: Public Records
Tax History Compared to Growth
Tax History
| Year | Tax Paid | Tax Assessment Tax Assessment Total Assessment is a certain percentage of the fair market value that is determined by local assessors to be the total taxable value of land and additions on the property. | Land | Improvement |
|---|---|---|---|---|
| 2024 | $1,011 | $85,299 | -- | -- |
| 2023 | $953 | $81,163 | $0 | $0 |
| 2022 | $920 | $78,799 | $13,233 | $65,566 |
| 2021 | $1,222 | $64,727 | $9,452 | $55,275 |
| 2020 | $1,160 | $60,907 | $11,342 | $49,565 |
| 2019 | $1,051 | $49,739 | $9,452 | $40,287 |
| 2018 | $954 | $45,062 | $7,562 | $37,500 |
| 2017 | $846 | $34,132 | $7,562 | $26,570 |
| 2016 | $825 | $33,441 | $0 | $0 |
| 2015 | $773 | $30,401 | $0 | $0 |
| 2014 | $737 | $29,623 | $0 | $0 |
Source: Public Records
Map
Nearby Homes
- 5330 SE 30th Ave
- 5315 SE 26th Ave
- 5280 SE 32nd Ct
- 0 SE 31st Terrace Unit MFROM703201
- 3060 SE 48th St
- 3070 SE 47th St
- 5011 SE 33rd Ave
- 5002 SE 33rd Terrace
- 0 SE 45 St
- 4779 SE 34th Terrace
- 5701 SE 33rd Ct
- 4280 SE 26th Terrace Rd
- 3341 SE 45th St
- 0 SE 47th St
- 6634 SE 22nd Ave
- 2406 SE 40th Street Rd
- 00 SE 41st St
- 2062 SE 52nd St
- 3663 SE 45th Place
- 2151 SE 59th St
- 5211 SE 29th Ave
- 2920 SE 52nd St
- 2830 SE 52nd St
- 5221 SE 29th Ct
- 2915 SE 52nd St
- 5230 SE 29th Ave
- 2930 SE 52nd St
- 5200 SE 30th Ave
- 2820 SE 52nd St
- 5301 SE 29th Ave
- 5155 SE 28th Ct
- 5221 SE 28th Ct
- 5220 SE 30th Ave
- 5231 SE 29th Ct
- 5231 SE 28th Ct
- 5300 SE 30th Ave
- 5151 SE 28th Ct
- 5311 SE 29th Ave
- 5301 SE 28th Ct
- 3000 SE 52nd St