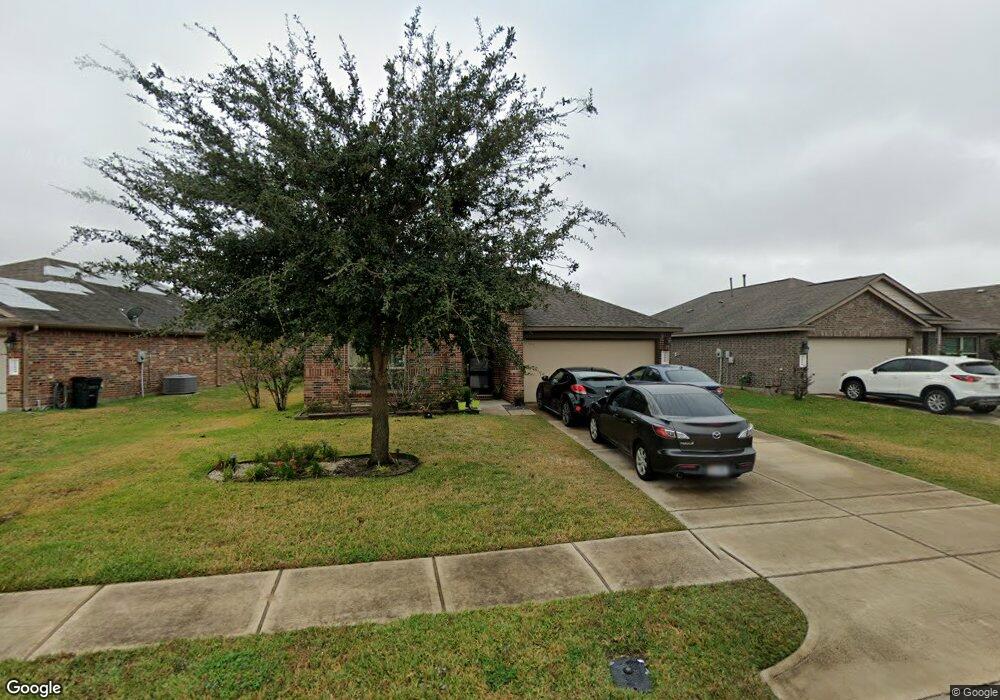
29010 Jacobs River Dr Katy, TX 77494
Tamarron NeighborhoodEstimated Value: $279,088 - $307,000
4
Beds
2
Baths
1,566
Sq Ft
$186/Sq Ft
Est. Value
About This Home
This home is located at 29010 Jacobs River Dr, Katy, TX 77494 and is currently estimated at $290,522, approximately $185 per square foot. 29010 Jacobs River Dr is a home located in Fort Bend County with nearby schools including Dean Leaman Junior High School, Fulshear High School, and Sugar Creek Montessori - Fulshear/West Katy.
Ownership History
Date
Name
Owned For
Owner Type
Purchase Details
Closed on
Jun 1, 2016
Sold by
R Horton D
Bought by
Rivers Chad Joseph
Current Estimated Value
Home Financials for this Owner
Home Financials are based on the most recent Mortgage that was taken out on this home.
Original Mortgage
$159,696
Outstanding Balance
$71,519
Interest Rate
3.59%
Mortgage Type
Purchase Money Mortgage
Estimated Equity
$219,003
Purchase Details
Closed on
May 25, 2016
Sold by
D R Horton Texas Ltd
Bought by
Zuniga Erika
Home Financials for this Owner
Home Financials are based on the most recent Mortgage that was taken out on this home.
Original Mortgage
$159,696
Outstanding Balance
$71,519
Interest Rate
3.59%
Mortgage Type
Purchase Money Mortgage
Estimated Equity
$219,003
Purchase Details
Closed on
Jul 7, 2015
Sold by
D R Horton-Texas Ltd
Bought by
Zuniga Erika
Create a Home Valuation Report for This Property
The Home Valuation Report is an in-depth analysis detailing your home's value as well as a comparison with similar homes in the area
Home Values in the Area
Average Home Value in this Area
Purchase History
| Date | Buyer | Sale Price | Title Company |
|---|---|---|---|
| Rivers Chad Joseph | -- | None Available | |
| Zuniga Erika | -- | None Available | |
| Zuniga Erika | -- | -- |
Source: Public Records
Mortgage History
| Date | Status | Borrower | Loan Amount |
|---|---|---|---|
| Open | Rivers Chad Joseph | $159,696 | |
| Closed | Zuniga Erika | $156,000 |
Source: Public Records
Tax History Compared to Growth
Tax History
| Year | Tax Paid | Tax Assessment Tax Assessment Total Assessment is a certain percentage of the fair market value that is determined by local assessors to be the total taxable value of land and additions on the property. | Land | Improvement |
|---|---|---|---|---|
| 2025 | $7,477 | $273,579 | $60,060 | $213,519 |
| 2024 | $7,477 | $273,133 | $60,060 | $213,073 |
| 2023 | $5,572 | $252,109 | $0 | $256,793 |
| 2022 | $6,081 | $229,190 | $19,490 | $209,700 |
| 2021 | $6,386 | $208,350 | $46,200 | $162,150 |
| 2020 | $6,030 | $195,000 | $42,000 | $153,000 |
| 2019 | $5,987 | $186,870 | $42,000 | $144,870 |
| 2018 | $6,105 | $181,760 | $42,000 | $139,760 |
| 2017 | $6,178 | $183,650 | $40,000 | $143,650 |
| 2016 | $3,016 | $89,640 | $38,000 | $51,640 |
Source: Public Records
Map
Nearby Homes
- 29014 Jacobs River Dr
- 29003 Jacobs River Dr
- 28919 Crested Butte Dr
- 29102 Jarvis Bay Pass
- 29011 Oldfield Ct
- 29203 Jacobs River Dr
- 2843 Mcdonough Way
- 2907 Isla Gorge Ct
- 28938 Grand Teton Ct
- 2818 Mcdonough Way
- 29018 Pinnacle Ridge Dr
- 28710 Fitzroy Harbour
- 3010 Village Creek Dr
- 29046 Davenport Dr
- 2851 Park Hills Dr
- 29323 Crested Butte Dr
- 28915 Davenport Dr
- 2718 Misty Laurel Ct
- 29011 Erica Lee Ct
- 29110 Davenport Dr
- 29006 Jacobs River Dr
- 29018 Jacobs River Dr
- 29018 Jacobs River Dr
- 29007 Jacobs River Dr
- 29022 Jacobs River Dr
- 29011 Jacobs River Dr
- 29015 Jacobs River Dr
- 29015 Jacobs River Dr
- 29115 Innes Park Place
- 29019 Jacobs River Dr
- 29111 Innes Park Place
- 29119 Innes Park Place
- 29026 Jacobs River Dr
- 29027 Jacobs River Dr
- 29018 Innes Park Place
- 29026 Innes Park Place
- 29123 Innes Park Place
- 29030 Innes Park Place
- 29030 Jacobs River Dr
- 29034 Innes Park Place