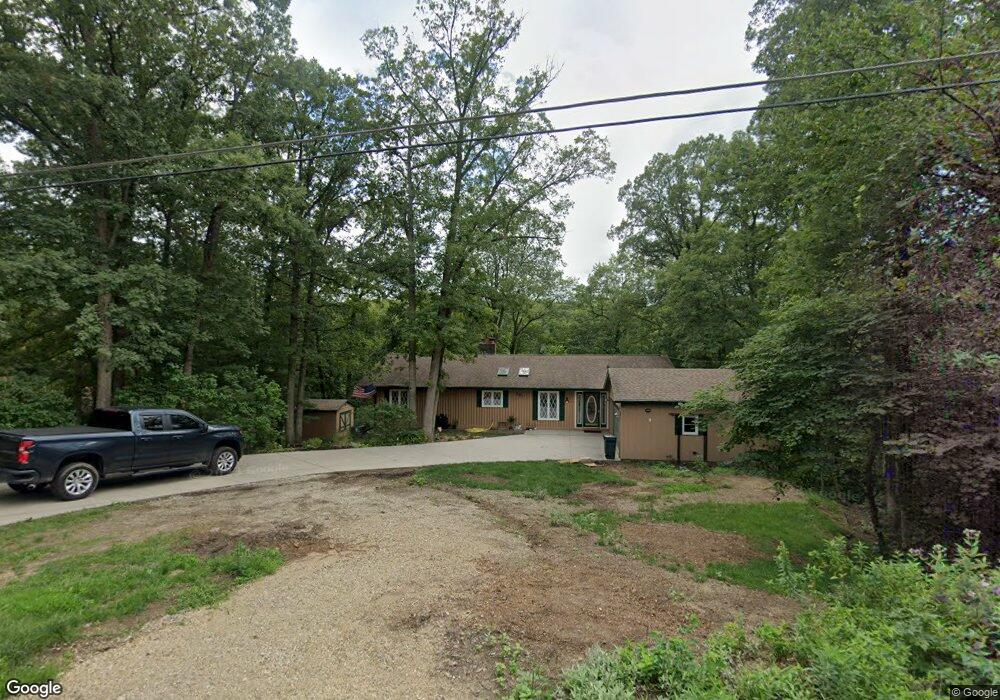
291 Wildwood Dr Groveland, IL 61535
Estimated Value: $266,000 - $304,000
3
Beds
3
Baths
1,680
Sq Ft
$169/Sq Ft
Est. Value
About This Home
This home is located at 291 Wildwood Dr, Groveland, IL 61535 and is currently estimated at $283,121, approximately $168 per square foot. 291 Wildwood Dr is a home located in Tazewell County with nearby schools including Morton High School and Bethel Lutheran School.
Ownership History
Date
Name
Owned For
Owner Type
Purchase Details
Closed on
Nov 15, 2022
Sold by
Scott Penny S
Bought by
Kaliski Michael G and Dunn Morgan R
Current Estimated Value
Home Financials for this Owner
Home Financials are based on the most recent Mortgage that was taken out on this home.
Original Mortgage
$218,500
Outstanding Balance
$211,492
Interest Rate
6.94%
Mortgage Type
New Conventional
Estimated Equity
$71,629
Purchase Details
Closed on
Jun 24, 2019
Sold by
Pratt Debra
Bought by
Scott Steven J and Scott Penny S
Purchase Details
Closed on
Mar 13, 2015
Sold by
Bushell Andrew A and Bashell Julie A
Bought by
Pratt Debera
Home Financials for this Owner
Home Financials are based on the most recent Mortgage that was taken out on this home.
Original Mortgage
$25,001
Interest Rate
3.97%
Mortgage Type
New Conventional
Create a Home Valuation Report for This Property
The Home Valuation Report is an in-depth analysis detailing your home's value as well as a comparison with similar homes in the area
Home Values in the Area
Average Home Value in this Area
Purchase History
| Date | Buyer | Sale Price | Title Company |
|---|---|---|---|
| Kaliski Michael G | $230,000 | -- | |
| Scott Steven J | -- | None Available | |
| Pratt Debera | $201,500 | Peoria Title Llc |
Source: Public Records
Mortgage History
| Date | Status | Borrower | Loan Amount |
|---|---|---|---|
| Open | Kaliski Michael G | $218,500 | |
| Previous Owner | Pratt Debera | $25,001 | |
| Previous Owner | Pratt Debera | $118,800 |
Source: Public Records
Tax History Compared to Growth
Tax History
| Year | Tax Paid | Tax Assessment Tax Assessment Total Assessment is a certain percentage of the fair market value that is determined by local assessors to be the total taxable value of land and additions on the property. | Land | Improvement |
|---|---|---|---|---|
| 2024 | $4,495 | $75,010 | $15,830 | $59,180 |
| 2023 | $4,495 | $68,860 | $14,530 | $54,330 |
| 2022 | $4,334 | $63,690 | $13,440 | $50,250 |
| 2021 | $4,334 | $61,240 | $12,920 | $48,320 |
| 2020 | $3,685 | $61,240 | $12,920 | $48,320 |
| 2019 | $3,677 | $61,240 | $12,920 | $48,320 |
| 2018 | $3,565 | $61,240 | $12,920 | $48,320 |
| 2017 | $3,473 | $59,320 | $12,510 | $46,810 |
| 2016 | $3,435 | $59,320 | $12,510 | $46,810 |
| 2015 | $3,692 | $0 | $0 | $0 |
| 2013 | $3,656 | $59,320 | $12,510 | $46,810 |
Source: Public Records
Map
Nearby Homes
- 305 Conaghan Dr
- 4851 Sheridan Rd
- 210 Apache Way
- 305 Apache Way
- 123 Apache Way
- 109 Apache Way
- 417 Apache Way
- 105 Apache Way
- 101 Apache Way
- 19314 Springfield Rd
- 105 Sheffield Rd
- 19478 Springfield Rd
- 5559 Broadway Rd
- 16810 Springfield Rd
- 3747 Grandview Ct
- 5859 Broadway Rd
- Lot 37 Grandview Ct
- Lot 2 Grandview Ct
- Lot 13 Grandview Ct
- Lot 33 Grandview Ct
- 313 Wildwood Dr
- 275 Wildwood Dr
- 304 Wildwood Dr
- 116 Timber Cir
- 262 Wildwood Dr
- 261 Wildwood Dr
- 335 Wildwood Dr
- 151 Timber Cir
- 369 Wildwood Dr
- 142 Timber Cir
- 354 Wildwood Dr
- 193 Timber Cir
- 168 Timber Cir
- 381 Wildwood Dr
- 499 Wildwood Dr
- 479 Bessler Lake Dr
- 316 Whispering Oaks Dr
- 245 Timber Cir
- 245 Timber Cir
- 234 Wildwood Dr