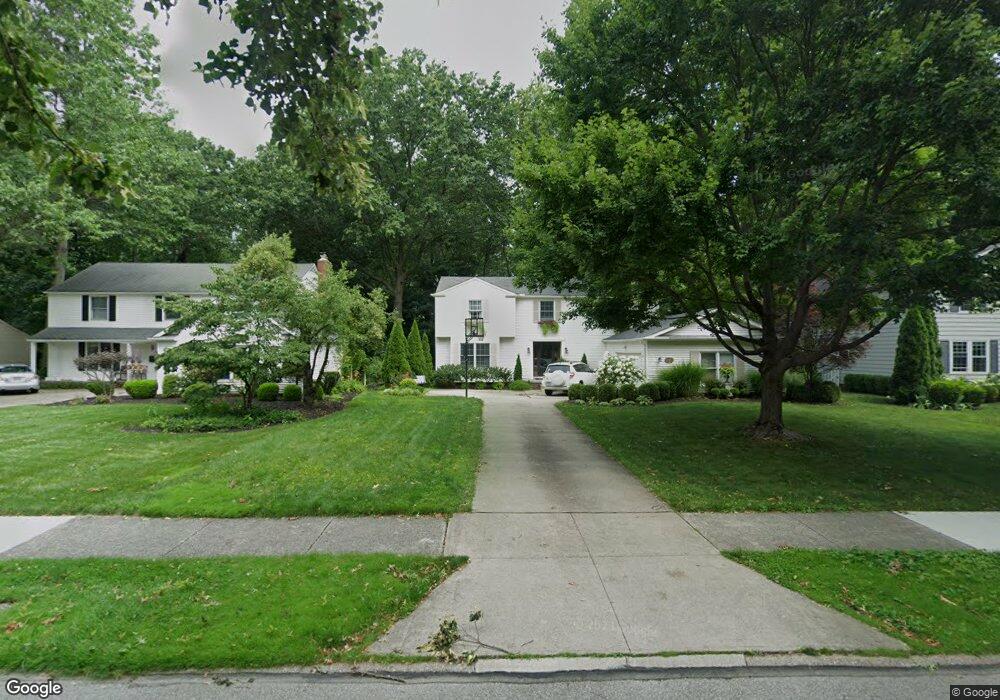
29114 Buchanan Dr Bay Village, OH 44140
Estimated Value: $524,000 - $560,000
4
Beds
3
Baths
2,478
Sq Ft
$216/Sq Ft
Est. Value
About This Home
This home is located at 29114 Buchanan Dr, Bay Village, OH 44140 and is currently estimated at $534,616, approximately $215 per square foot. 29114 Buchanan Dr is a home located in Cuyahoga County with nearby schools including Westerly Elementary School, Normandy Elementary School, and Bay Middle School.
Ownership History
Date
Name
Owned For
Owner Type
Purchase Details
Closed on
Jun 7, 2005
Sold by
National Residential Nominee Services In
Bought by
Walsh Seamus E and Walsh Megan C
Current Estimated Value
Home Financials for this Owner
Home Financials are based on the most recent Mortgage that was taken out on this home.
Original Mortgage
$250,400
Interest Rate
5.86%
Mortgage Type
Fannie Mae Freddie Mac
Purchase Details
Closed on
Mar 15, 2005
Sold by
Buchta Julie A and Buchta John A
Bought by
National Residential Nominee Services In
Purchase Details
Closed on
Dec 23, 1993
Sold by
Molenar Glenn Cle
Bought by
Buchta Julie A
Purchase Details
Closed on
Jan 30, 1978
Sold by
Molenar Glen C
Bought by
Molenar Glenn Cle
Purchase Details
Closed on
Dec 2, 1977
Sold by
Pierre Ronald A and Pierre Barbara
Bought by
Molenar Glen C
Purchase Details
Closed on
Jan 1, 1975
Bought by
Pierre Ronald A and Pierre Barbara
Create a Home Valuation Report for This Property
The Home Valuation Report is an in-depth analysis detailing your home's value as well as a comparison with similar homes in the area
Home Values in the Area
Average Home Value in this Area
Purchase History
| Date | Buyer | Sale Price | Title Company |
|---|---|---|---|
| Walsh Seamus E | $313,000 | Chicago Title Insurance C | |
| National Residential Nominee Services In | -- | Chicago Title Insurance C | |
| Buchta Julie A | $202,000 | -- | |
| Molenar Glenn Cle | -- | -- | |
| Molenar Glen C | $88,500 | -- | |
| Pierre Ronald A | -- | -- |
Source: Public Records
Mortgage History
| Date | Status | Borrower | Loan Amount |
|---|---|---|---|
| Closed | Walsh Seamus E | $250,400 |
Source: Public Records
Tax History Compared to Growth
Tax History
| Year | Tax Paid | Tax Assessment Tax Assessment Total Assessment is a certain percentage of the fair market value that is determined by local assessors to be the total taxable value of land and additions on the property. | Land | Improvement |
|---|---|---|---|---|
| 2024 | $10,681 | $157,605 | $27,580 | $130,025 |
| 2023 | $10,240 | $128,000 | $24,920 | $103,080 |
| 2022 | $10,192 | $128,000 | $24,920 | $103,080 |
| 2021 | $9,236 | $128,000 | $24,920 | $103,080 |
| 2020 | $9,335 | $116,340 | $22,650 | $93,700 |
| 2019 | $9,064 | $332,400 | $64,700 | $267,700 |
| 2018 | $9,055 | $116,340 | $22,650 | $93,700 |
| 2017 | $8,868 | $103,640 | $18,030 | $85,610 |
| 2016 | $8,832 | $103,640 | $18,030 | $85,610 |
| 2015 | $7,941 | $103,640 | $18,030 | $85,610 |
| 2014 | $7,941 | $95,980 | $16,700 | $79,280 |
Source: Public Records
Map
Nearby Homes
- 589 Debbington Dr
- 624 Millard Dr
- 29305 Osborn Rd
- 29806 Osborn Rd
- 625 Bassett Rd
- 28205 W Oviatt Rd
- 27870 Birchwood Ct
- 798 N Greenway Dr
- 841 S Parkside Dr
- 879 S Parkside Dr
- 433 Bassett Rd
- 27841 Birchwood Ct
- 382 Bassett Rd
- 30200 Westlawn Dr
- 340 Bassett Rd
- 477 Cahoon Rd
- 479 Cahoon Rd
- 481 Cahoon Rd
- 495 Cahoon Rd
- 27407 Wolf Rd
- 29110 Buchanan Dr
- 29122 Buchanan Dr
- 29074 Buchanan Dr
- 29132 Buchanan Dr
- 29115 Lincoln Rd
- 29111 Lincoln Rd
- 29123 Lincoln Rd
- 29032 Buchanan Dr
- 29111 Buchanan Dr
- 29210 Buchanan Dr
- 29119 Buchanan Dr
- 29075 Lincoln Rd
- 29131 Lincoln Rd
- 29075 Buchanan Dr
- 29033 Lincoln Rd
- 29016 Buchanan Dr
- 29216 Buchanan Dr
- 29211 Lincoln Rd
- 29201 Buchanan Dr
- 29033 Buchanan Dr