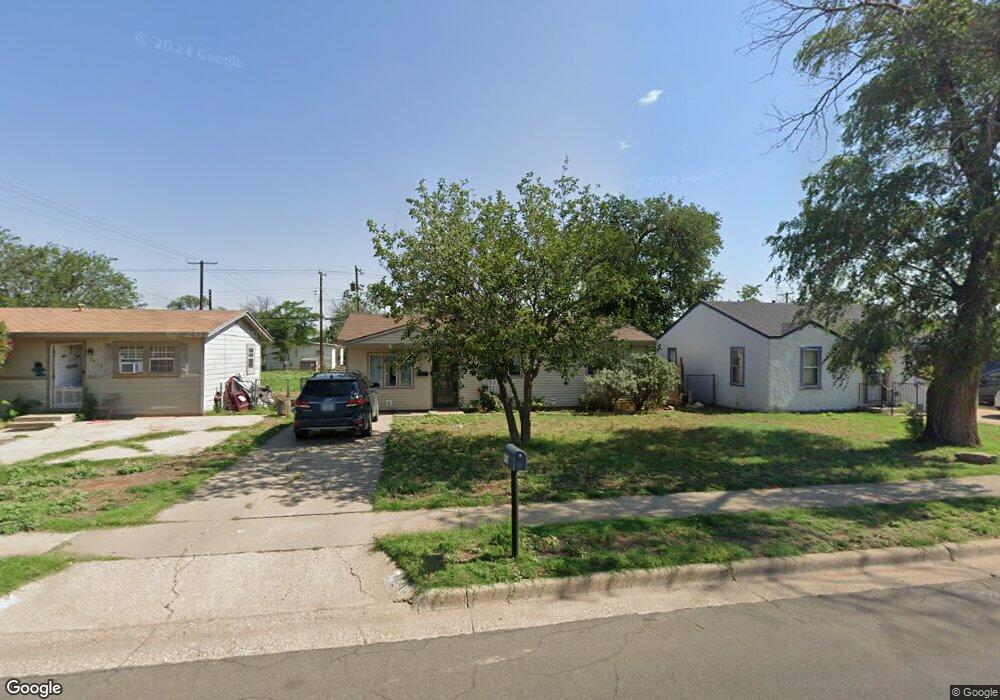
2916 2nd Place Lubbock, TX 79415
Arnett Benson NeighborhoodEstimated Value: $90,000 - $97,000
3
Beds
1
Bath
912
Sq Ft
$103/Sq Ft
Est. Value
About This Home
This home is located at 2916 2nd Place, Lubbock, TX 79415 and is currently estimated at $93,926, approximately $102 per square foot. 2916 2nd Place is a home located in Lubbock County with nearby schools including McWhorter Elementary School, Cavazos Middle School, and Lubbock High School.
Ownership History
Date
Name
Owned For
Owner Type
Purchase Details
Closed on
Jul 23, 2021
Sold by
Benton Jane and Benton Del Lonnie
Bought by
Ingram Dallas Cemon and Ingram Jacqueline M
Current Estimated Value
Home Financials for this Owner
Home Financials are based on the most recent Mortgage that was taken out on this home.
Original Mortgage
$85,500
Outstanding Balance
$77,649
Interest Rate
2.96%
Mortgage Type
New Conventional
Estimated Equity
$16,277
Create a Home Valuation Report for This Property
The Home Valuation Report is an in-depth analysis detailing your home's value as well as a comparison with similar homes in the area
Home Values in the Area
Average Home Value in this Area
Purchase History
| Date | Buyer | Sale Price | Title Company |
|---|---|---|---|
| Ingram Dallas Cemon | -- | None Available |
Source: Public Records
Mortgage History
| Date | Status | Borrower | Loan Amount |
|---|---|---|---|
| Open | Ingram Dallas Cemon | $85,500 |
Source: Public Records
Tax History Compared to Growth
Tax History
| Year | Tax Paid | Tax Assessment Tax Assessment Total Assessment is a certain percentage of the fair market value that is determined by local assessors to be the total taxable value of land and additions on the property. | Land | Improvement |
|---|---|---|---|---|
| 2025 | $1,559 | $81,357 | $15,500 | $65,857 |
| 2024 | $1,559 | $87,330 | $2,250 | $85,080 |
| 2023 | $1,330 | $71,559 | $2,250 | $69,309 |
| 2022 | $1,533 | $75,709 | $2,250 | $73,459 |
| 2021 | $1,404 | $65,559 | $2,250 | $66,404 |
| 2020 | $1,296 | $59,599 | $2,250 | $57,349 |
| 2019 | $1,338 | $59,593 | $2,250 | $57,343 |
| 2018 | $1,218 | $54,175 | $2,250 | $51,925 |
| 2017 | $1,108 | $49,250 | $2,250 | $47,000 |
| 2016 | $1,144 | $50,837 | $1,250 | $49,587 |
| 2015 | $229 | $51,658 | $1,250 | $50,408 |
| 2014 | $229 | $47,543 | $1,250 | $46,293 |
Source: Public Records
Map
Nearby Homes