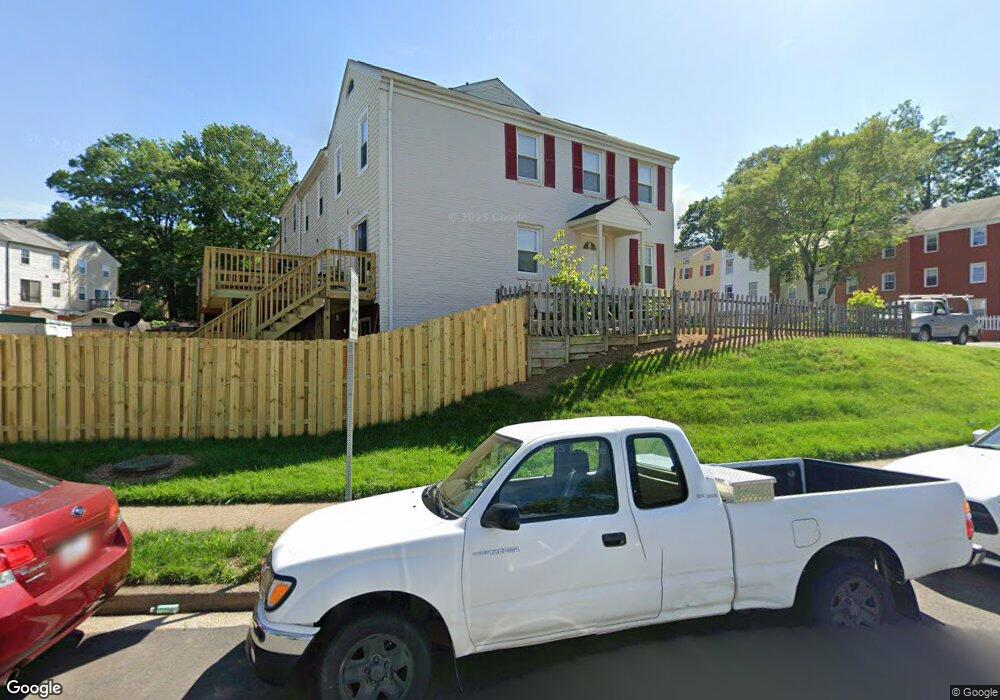
2916 Williamsburg Ct Woodbridge, VA 22191
River Oaks NeighborhoodEstimated Value: $336,756 - $354,000
3
Beds
2
Baths
1,330
Sq Ft
$258/Sq Ft
Est. Value
About This Home
This home is located at 2916 Williamsburg Ct, Woodbridge, VA 22191 and is currently estimated at $343,689, approximately $258 per square foot. 2916 Williamsburg Ct is a home located in Prince William County with nearby schools including River Oaks Elementary School, Potomac Middle School, and Potomac High School.
Ownership History
Date
Name
Owned For
Owner Type
Purchase Details
Closed on
Dec 28, 2011
Sold by
Dechat Peter A
Bought by
Dechat Properties Seven Llc
Current Estimated Value
Purchase Details
Closed on
Jul 23, 2009
Sold by
Bac Home Loans Servicing Lp
Bought by
Dechat Peter A
Purchase Details
Closed on
Jun 9, 2009
Sold by
Pommer Heidi
Bought by
Countrywide Bank Fsb
Purchase Details
Closed on
Dec 9, 2005
Sold by
Barron Charlie
Bought by
Pommer Heidi
Home Financials for this Owner
Home Financials are based on the most recent Mortgage that was taken out on this home.
Original Mortgage
$200,000
Interest Rate
6.34%
Mortgage Type
New Conventional
Purchase Details
Closed on
Nov 1, 1995
Sold by
Sec Of Hud
Bought by
Barron Kathy L
Home Financials for this Owner
Home Financials are based on the most recent Mortgage that was taken out on this home.
Original Mortgage
$42,842
Interest Rate
7.58%
Create a Home Valuation Report for This Property
The Home Valuation Report is an in-depth analysis detailing your home's value as well as a comparison with similar homes in the area
Home Values in the Area
Average Home Value in this Area
Purchase History
| Date | Buyer | Sale Price | Title Company |
|---|---|---|---|
| Dechat Properties Seven Llc | -- | -- | |
| Dechat Peter A | $60,000 | First American | |
| Countrywide Bank Fsb | -- | None Available | |
| Pommer Heidi | $250,000 | -- | |
| Barron Kathy L | $40,170 | -- |
Source: Public Records
Mortgage History
| Date | Status | Borrower | Loan Amount |
|---|---|---|---|
| Previous Owner | Pommer Heidi | $200,000 | |
| Previous Owner | Barron Kathy L | $42,842 |
Source: Public Records
Tax History Compared to Growth
Tax History
| Year | Tax Paid | Tax Assessment Tax Assessment Total Assessment is a certain percentage of the fair market value that is determined by local assessors to be the total taxable value of land and additions on the property. | Land | Improvement |
|---|---|---|---|---|
| 2025 | $3,010 | $313,100 | $125,400 | $187,700 |
| 2024 | $3,010 | $302,700 | $120,500 | $182,200 |
| 2023 | $2,837 | $272,700 | $107,600 | $165,100 |
| 2022 | $2,821 | $254,700 | $99,700 | $155,000 |
| 2021 | $2,914 | $235,600 | $91,500 | $144,100 |
| 2020 | $3,204 | $206,700 | $80,200 | $126,500 |
| 2019 | $2,971 | $191,700 | $75,000 | $116,700 |
| 2018 | $2,093 | $173,300 | $67,000 | $106,300 |
| 2017 | $1,992 | $157,400 | $60,400 | $97,000 |
| 2016 | $2,105 | $168,400 | $64,200 | $104,200 |
| 2015 | $1,883 | $148,800 | $56,300 | $92,500 |
| 2014 | $1,883 | $146,700 | $55,200 | $91,500 |
Source: Public Records
Map
Nearby Homes
- 2903 Williamsburg Ct
- 2905 Wren Ct
- 2927 Pheasant Ln
- 16603 Sutton Place
- 2922 Truffle Oak Place
- 16707 Chowning Ct
- 2910 Truffle Oak Place
- 2756 Brier Pond Cir
- 2728 Brier Pond Cir
- 16880 Winston Ln
- 2902 Chevoit Hill Ct
- 16787 Brandy Moor Loop
- 16317 Eagle Flight Cir
- 16580 Telescope Ln
- 3130 Eagle Talon St
- 2610 Grayton Ln
- 16249 Chase Eagle Ln
- 3354 Cape May Ct
- 3390 Mystic Ct
- 17003 Hoskins Way Unit 80
- 2918 Williamsburg Ct
- 2920 Williamsburg Ct
- 2914 Williamsburg Ct
- 2919 Williamsburg Ct
- 2912 Williamsburg Ct
- 2917 Williamsburg Ct
- 2910 Williamsburg Ct
- 2908 Williamsburg Ct
- 2899 Williamsburg Ct
- 2906 Williamsburg Ct
- 2915 Williamsburg Ct
- 2913 Williamsburg Ct
- 2904 Williamsburg Ct
- 2911 Williamsburg Ct
- 2902 Williamsburg Ct
- 2909 Williamsburg Ct
- 2918 Wren Ct
- 2916 Wren Ct
- 2907 Williamsburg Ct
- 2900 Williamsburg Ct