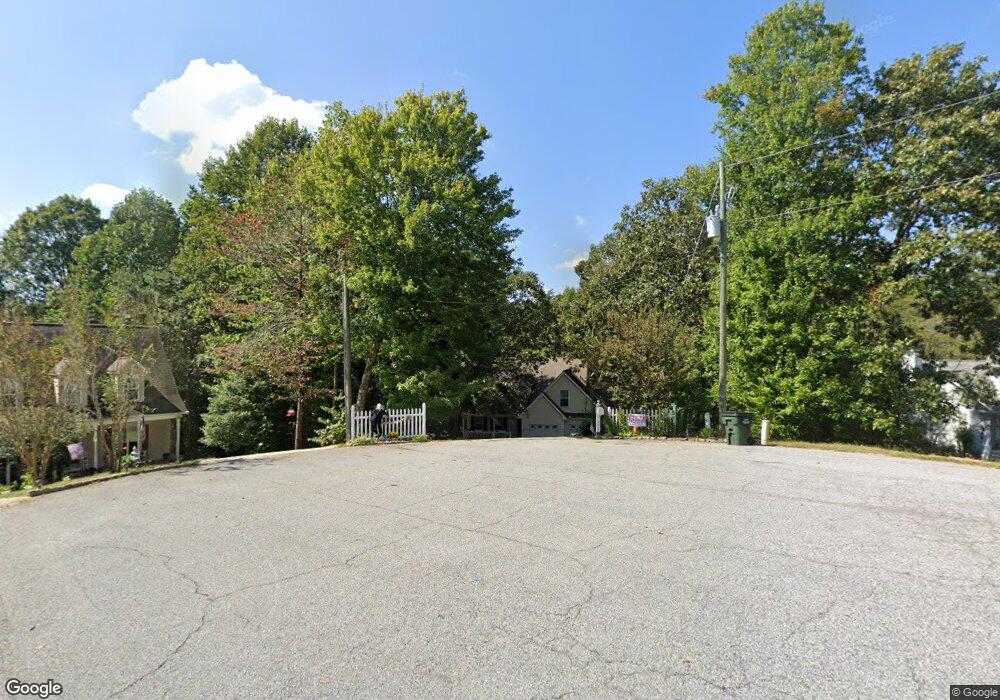
292 Holly Ridge Unit 4 Dahlonega, GA 30533
Estimated Value: $495,056 - $698,000
5
Beds
4
Baths
2,999
Sq Ft
$188/Sq Ft
Est. Value
About This Home
This home is located at 292 Holly Ridge Unit 4, Dahlonega, GA 30533 and is currently estimated at $562,514, approximately $187 per square foot. 292 Holly Ridge Unit 4 is a home located in Lumpkin County with nearby schools including Clay County Middle School and Lumpkin County High School.
Ownership History
Date
Name
Owned For
Owner Type
Purchase Details
Closed on
Oct 6, 2018
Sold by
Canupp Jason D
Bought by
Canupp Jason D and Canupp Jessica Kerr
Current Estimated Value
Purchase Details
Closed on
Oct 4, 2018
Sold by
Izzo George Estate
Bought by
Canupp Jason D
Purchase Details
Closed on
May 12, 2010
Sold by
Federal Home Loan Mortgage Corporation
Bought by
Izzo George
Home Financials for this Owner
Home Financials are based on the most recent Mortgage that was taken out on this home.
Original Mortgage
$130,000
Interest Rate
5.02%
Mortgage Type
New Conventional
Purchase Details
Closed on
Jul 7, 2009
Sold by
Us Bank Na
Bought by
Federal Homel Oan Mortgage Corp
Purchase Details
Closed on
May 28, 2004
Sold by
Howell Herman
Bought by
Howell Herman and Howell Betty
Purchase Details
Closed on
Sep 15, 2003
Sold by
Robinson Hoyt E
Bought by
Howell Herman
Create a Home Valuation Report for This Property
The Home Valuation Report is an in-depth analysis detailing your home's value as well as a comparison with similar homes in the area
Home Values in the Area
Average Home Value in this Area
Purchase History
| Date | Buyer | Sale Price | Title Company |
|---|---|---|---|
| Canupp Jason D | -- | -- | |
| Canupp Jason D | $249,900 | -- | |
| Izzo George | $180,200 | -- | |
| Federal Homel Oan Mortgage Corp | -- | -- | |
| Howell Herman | -- | -- | |
| Howell Herman | $32,500 | -- |
Source: Public Records
Mortgage History
| Date | Status | Borrower | Loan Amount |
|---|---|---|---|
| Previous Owner | Izzo George | $130,000 |
Source: Public Records
Tax History Compared to Growth
Tax History
| Year | Tax Paid | Tax Assessment Tax Assessment Total Assessment is a certain percentage of the fair market value that is determined by local assessors to be the total taxable value of land and additions on the property. | Land | Improvement |
|---|---|---|---|---|
| 2024 | $3,096 | $136,278 | $12,650 | $123,628 |
| 2023 | $2,568 | $128,726 | $12,650 | $116,076 |
| 2022 | $2,872 | $118,016 | $12,650 | $105,366 |
| 2021 | $2,551 | $101,640 | $12,650 | $88,990 |
| 2020 | $2,570 | $99,435 | $12,650 | $86,785 |
| 2019 | $2,647 | $99,435 | $12,650 | $86,785 |
| 2018 | $2,513 | $88,590 | $12,650 | $75,940 |
| 2017 | $213 | $85,581 | $12,650 | $72,931 |
| 2016 | $157 | $79,996 | $12,650 | $67,346 |
| 2015 | $2,076 | $79,996 | $12,650 | $67,346 |
| 2014 | $2,076 | $80,753 | $12,650 | $68,103 |
| 2013 | -- | $81,509 | $12,650 | $68,859 |
Source: Public Records
Map
Nearby Homes
- 72 Rustin Ridge Unit 276
- 58 Rustin Ridge Unit 278
- 42 Rustin Ridge Unit 285
- 1376 Robinson Rd
- 2041 Long Branch Rd
- 2041 Long Branch Rd Unit TRACT 2A
- 38 Cavender Run
- 0 Robinson Rd Unit 10597950
- 0 Robinson Rd Unit 7643549
- 0 Gold Crest Dr Unit 7623108
- 0 Gold Crest Dr Unit 10373986
- 134 Prospector Ridge
- 67 Quartz Way
- 201 Perkins Rd
- 205 Perkins Rd
- 0 Stamp Mill Dr
- 245 Perkins Rd
- 133 Stamp Mill Dr
- 103 Rockhound Dr
- 85 Waterloo Dr
- 292 Holly Ridge
- 297 Holly Ridge
- 272 Holly Ridge Unit 3
- 272 Holly Ridge
- 20 Robinson Ridge
- 242 Holly Ridge
- 20 Robinson Ridge
- 231 Holly Ridge
- 19 Early Dr
- 1332 Long Branch Rd
- 1048 Long Branch Rd
- 112 Holly Ridge Unit C,D
- 112 Holly Ridge
- 163 Holly Ridge
- 0 Holly Ridge Unit 7458845
- 74 Holly Ridge
- 109 Holly Ridge
- 305 Early Dr Unit 1
- 305 Early Dr
- Lot A Robinson Ridge Rd