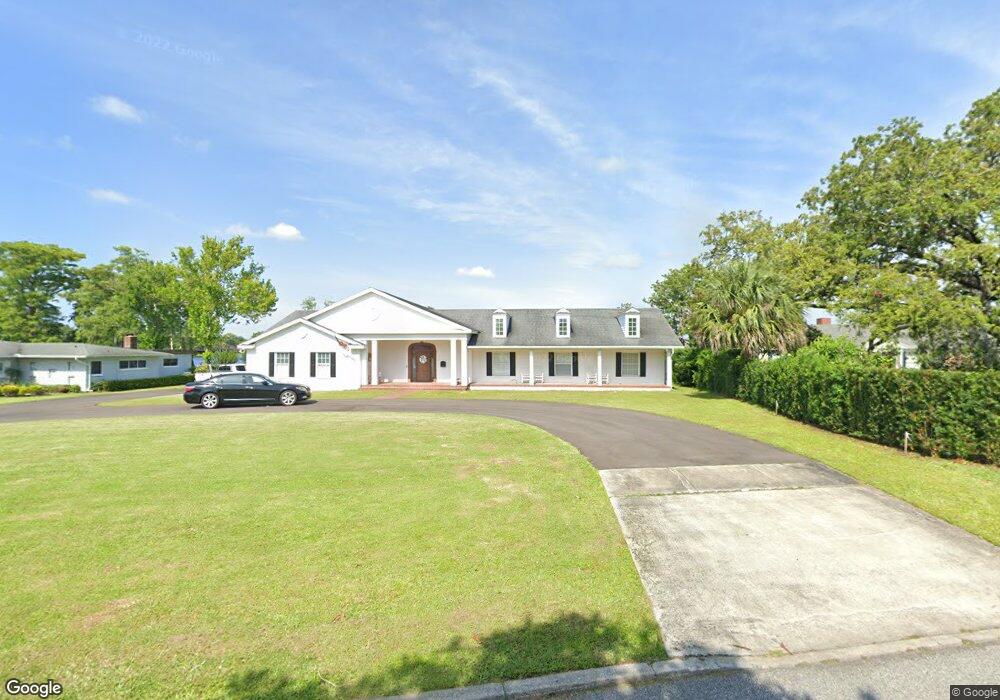
2920 N Westmoreland Dr Orlando, FL 32804
College Park NeighborhoodEstimated Value: $1,656,000 - $2,151,000
5
Beds
4
Baths
4,880
Sq Ft
$397/Sq Ft
Est. Value
About This Home
This home is located at 2920 N Westmoreland Dr, Orlando, FL 32804 and is currently estimated at $1,935,489, approximately $396 per square foot. 2920 N Westmoreland Dr is a home located in Orange County with nearby schools including Lake Silver Elementary School, College Park Middle School, and Edgewater High School.
Ownership History
Date
Name
Owned For
Owner Type
Purchase Details
Closed on
Jun 27, 2001
Sold by
Malcolm E Hawley M and Hawley M Nancy A
Bought by
Williams Leonard E and Williams Marilyn M
Current Estimated Value
Home Financials for this Owner
Home Financials are based on the most recent Mortgage that was taken out on this home.
Original Mortgage
$600,000
Outstanding Balance
$231,224
Interest Rate
7.14%
Estimated Equity
$1,704,265
Purchase Details
Closed on
Jun 4, 1999
Sold by
Ocwen Federal Bank Fsb
Bought by
Chon Yeong and Chon Sonia
Home Financials for this Owner
Home Financials are based on the most recent Mortgage that was taken out on this home.
Original Mortgage
$150,000
Interest Rate
6.9%
Mortgage Type
New Conventional
Purchase Details
Closed on
Mar 17, 1999
Sold by
Clerk Of The Court
Bought by
Bankers Direct Mortgage Corporation
Create a Home Valuation Report for This Property
The Home Valuation Report is an in-depth analysis detailing your home's value as well as a comparison with similar homes in the area
Home Values in the Area
Average Home Value in this Area
Purchase History
| Date | Buyer | Sale Price | Title Company |
|---|---|---|---|
| Williams Leonard E | $625,000 | -- | |
| Chon Yeong | $532,000 | -- | |
| Bankers Direct Mortgage Corporation | $100 | -- |
Source: Public Records
Mortgage History
| Date | Status | Borrower | Loan Amount |
|---|---|---|---|
| Open | Bankers Direct Mortgage Corporation | $211,300 | |
| Closed | Bankers Direct Mortgage Corporation | $150,000 | |
| Open | Bankers Direct Mortgage Corporation | $600,000 | |
| Previous Owner | Bankers Direct Mortgage Corporation | $150,000 |
Source: Public Records
Tax History Compared to Growth
Tax History
| Year | Tax Paid | Tax Assessment Tax Assessment Total Assessment is a certain percentage of the fair market value that is determined by local assessors to be the total taxable value of land and additions on the property. | Land | Improvement |
|---|---|---|---|---|
| 2025 | $15,193 | $894,386 | -- | -- |
| 2024 | $14,635 | $894,386 | -- | -- |
| 2023 | $14,635 | $843,864 | $0 | $0 |
| 2022 | $14,238 | $819,285 | $0 | $0 |
| 2021 | $14,034 | $795,422 | $0 | $0 |
| 2020 | $13,372 | $784,440 | $0 | $0 |
| 2019 | $13,799 | $766,804 | $0 | $0 |
| 2018 | $13,678 | $752,506 | $0 | $0 |
| 2017 | $13,517 | $948,327 | $432,000 | $516,327 |
| 2016 | $13,474 | $865,880 | $400,000 | $465,880 |
| 2015 | $13,667 | $842,487 | $370,000 | $472,487 |
| 2014 | $13,738 | $750,900 | $360,000 | $390,900 |
Source: Public Records
Map
Nearby Homes
- 2616 N Westmoreland Dr
- 1002 W Par St Unit 16
- 2512 N Westmoreland Dr
- 1011 Vassar St
- 538 W Par St Unit 538
- 825 W Smith St
- 3520 N Westmoreland Dr
- 494 W Par St Unit 4
- 3203 Ardsley Dr
- 2305 Edgewater Dr Unit 1613
- 2305 Edgewater Dr Unit 1606
- 500 W Hazel St
- 1306 Radclyffe Rd
- 730 Edgewater Dr
- 915 W Princeton St
- 1321 Maury Rd
- 520 Bryn Mawr St
- 3215 Greens Ave
- 630 Vassar St Unit 2301
- 630 Vassar St Unit 2506
- 2910 N Westmoreland Dr
- 2930 N Westmoreland Dr
- 2904 N Westmoreland Dr
- 2933 N Westmoreland Dr
- 921 Silver Dr
- 918 Silver Dr
- 2900 N Westmoreland Dr
- 2909 N Westmoreland Dr
- 910 Silver Dr
- 913 Silver Dr
- 2903 N Westmoreland Dr
- 2812 N Westmoreland Dr
- 907 Silver Dr
- 2825 N Westmoreland Dr
- 2918 Carroll Place
- 2914 Carroll Place
- 2808 N Westmoreland Dr
- 2908 Carroll Place
- 903 Silver Dr
- 2819 N Westmoreland Dr